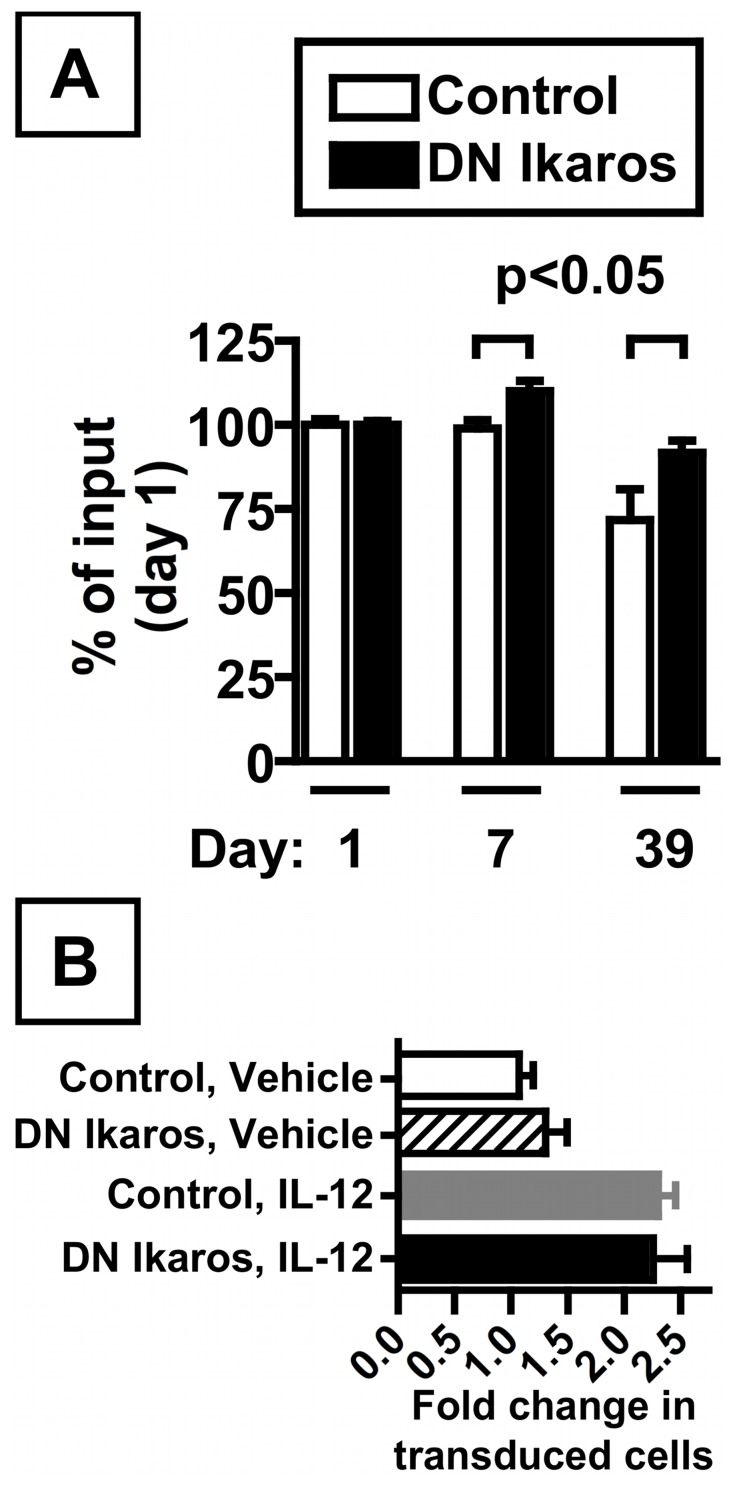
Figure 6. CD8 T cells expressing dominant negative Ikaros have a modest advantage in vivo.
(A) Relative abundance of retrovirally transduced cells within a pool of adoptively transferred CD8 T cells containing both transduced and non-transduced cells. Adoptively transferred cells were identified as live, CD8+ MHC class II negative cells that expressed CD45.1, with retrovirally transduced cells further expressing Thy1.1, with abundance measured within the peripheral blood of C57BL/6 recipient mice (which do not express CD45.1 or Thy1.1). Cells were transduced with a control retrovirus (white bar) or a DN Ikaros expressing retrovirus (black bar). To standardize for slightly different starting frequencies, values are standardized relative to day 1 input values for either control or DN Ikaros transduction efficiencies with data showing mean ± SEM with 3–10 mice for control transduced and 6–10 mice for DN Ikaros transduced cells. Mice were bled on day 1, 7, and 39 post-transfer. Statistically significant differences (p<0.05) are indicated, calculated by unpaired t test. (B) Fold change in the abundance of retrovirally transduced cells in C57BL/6J recipient mice from panel A (either control or DN Ikaros transduced) in the blood (defined as the percentage of live, CD8+ MHC class II negative cells that were CD45.1+ Thy1.1+) following injection of either vehicle alone or recombinant IL-12 (1 µg) at day 162 and 165 post-adoptive transfer, with abundance post-treatment measured at day 168 post-transfer. For these studies, at day 1 after adoptive transfer, the frequency of adoptively transferred, retrovirally transduced cells (defined as CD45.1+ Thy1.1+) among CD8 T cells in the peripheral blood was 1.21±0.07% for control and 1.70±0.09% for DN Ikaros transduced cells (mean ± SEM). Among adoptively transferred cells (CD45.1+), the percentage (mean ± SEM) of transduced cells was 42.1±0.7% for control and 49.6±0.5% for DN Ikaros.

