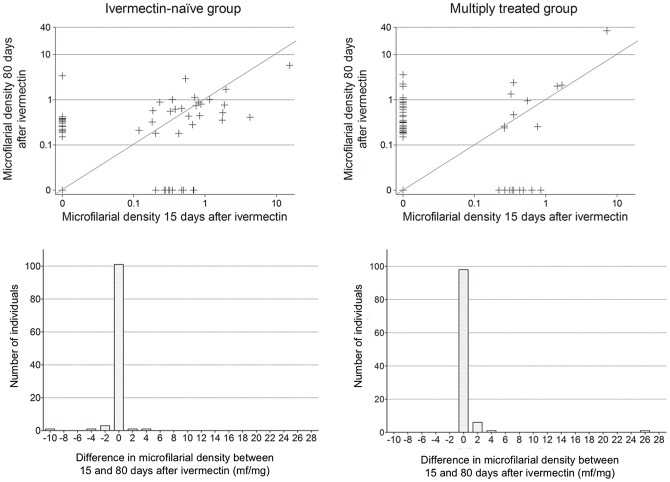
Figure 2. Evolution of Onchocerca volvulus microfilarial density (mf/mg) between 15 and 80 days after ivermectin treatment.
Microfilarial density at D80 is plotted against density at D15 (scatterplots), for each individual, in ivermectin-naïve and multiply treated subjects. Distribution of individual variation between 15 and 80 days post-treatment is also given (histograms) for the ivermectin-naïve and multiply treated subjects (positive difference means an increase between D15 and D80). Lines in scatterplots represent slope = 1, i.e no change in microfilarial density. X-axis below histograms indicates central values of 2 mf/mg width bins (e.g. 0 indicates microfilarial density between −1 and 1).

