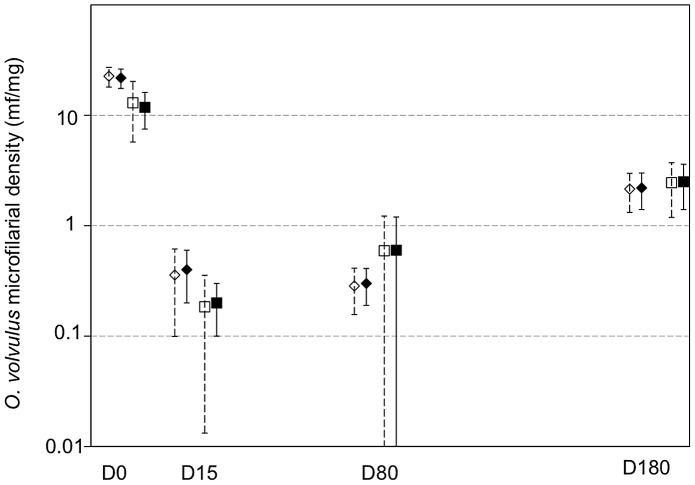
Figure 4. Observed and predicted mean microfilarial density in ivermectin naïve (diamonds) and multiply treated (squares) groups.
Filled symbols represent observed means and open symbols represent zero-inflated negative binomial predictions of the mean. Bars indicate 95% confidence intervals for both observations and predictions.

