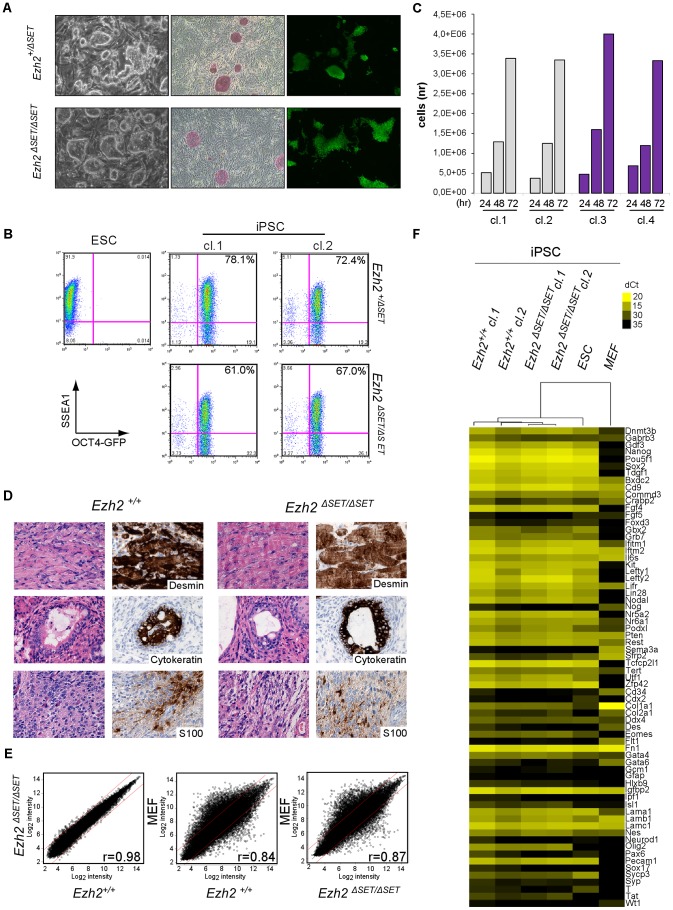
Figure 2. Characterization of pluripotency in iPSC clones reprogrammed upon Ezh2 inactivation.
A. Images of phase contrast (left), alkaline phosphatase staining (middle) and Oct4-driven GFP fluorescence (right) of representative control (Ezh2+/ΔSET, upper row) and mutant (Ezh2ΔSET/ΔSET, lower row) iPSC colonies. B. Flow cytometric analysis of SSEA-1 and endogenous OCT4 (OCT4-GFP) levels in representative control (Ezh2+/ΔSET, upper row) and mutant (Ezh2ΔSET/ΔSET, lower row) iPSC clones (cl.1 and cl.2). Embryonic stem cells (ESC) were used as positive control for SSEA1 expression (upper left). C. Growth curve of representative control (Ezh+/+, grey) and mutant (Ezh2ΔSET/ΔSET, purple) iPSC clones cultured in 2i/LIF medium for the indicated hours. Column height represents cell number. D. Hematoxylin & eosin staining and immunohistochemical analysis of representative sections of teratomas generated from either Ezh2 control (Ezh2+/+) or mutant (Ezh2ΔSET/ΔSET) iPSC cells of two representative clones. Stainings for mesoderm (upper row), endoderm (middle row) and ectoderm (lower row) markers are displayed. Data displayed in A, B, C and D are representative of at least four independent experiments, using two iPSC clones per genotype. E. Scatter plots showing global gene expression correlation analyses between Ezh2+/+ and Ezh2ΔSET/ΔSET iPSC (left panel), Ezh2+/+ iPSCs and MEF (central panel) and Ezh2ΔSET/ΔSET iPSC and MEF (right panel). Correlation coefficients (r) reveal the degree of similarity for each comparison. Genes within red lines differ less than 1.5-fold. F. Heat map representation of expression levels of genes involved in pluripotency, stemness and differentiation in two control (Ezh2+/+, first and second column) and two mutant (Ezh2ΔSET/ΔSET, third and fourth column) iPSC clones. ESC (fifth column) and MEF (last column) were used for comparison. Colors range from yellow (low dCt, higher expression) to black (high dCt, lower expression). Hierarchical clustering of samples is also shown.

