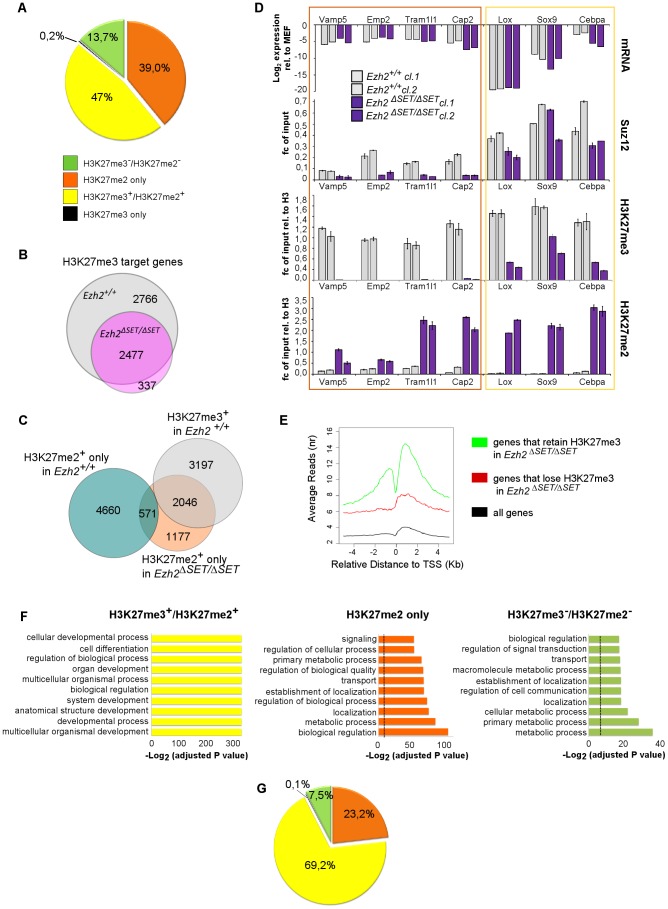
Figure 4. Genome-wide distribution of H3K27me3 in Ezh2ΔSET/ΔSET iPSC revealed through ChIP–seq.
A. Pie chart showing partition of Polycomb targets based on H3K27 methylation status in Ezh2ΔSET/ΔSET iPSCs. B. Venn diagram displaying overlap between H3K27me3+ genes in Ezh2 +/+ (grey) and Ezh2ΔSET/ΔSET (purple) iPSC. C. Venn diagram showing overlap between H3K27me3+ genes in Ezh2 +/+ iPSC (grey), H3K27me2+/H3K27me3− genes in Ezh2ΔSET/ΔSET iPSC (orange) and H3K27me2+/H3K27me3− in Ezh2 +/+ iPSC (light blue). D. Analysis of transcript levels measured by qRT-PCR, and status of SUZ12 binding, H3K27me2 and H3K27me1 enrichment revealed by ChIP q-PCR at promoters of 7 genes overexpressed in MEF relative to iPSC and representative of groups of genes marked by either H3K27me2+/H3K27me3+ or H3K27me2+/H3K27me3− in Ezh2ΔSET/ΔSET iPSC. For all analyses, two Ezh2 control (+/+; grey) iPSC clones were compared to two mutant (ΔSET/ΔSET; purple) counterparts. Levels of expression are shown as ddCt (log2 scale) relative to MEF. Status of a particular histone modification (±SEM) is represented as fold change of enrichment relative to input, after normalization for H3 density within the same amplicon. SUZ12 enrichment at promoters of indicated genes was determined comparing it to that of an unrelated IgG. Error bars refer to qPCR triplicates. E. Average reads distribution of H3K27me3 around the TSS in Ezh2 +/+ iPSC. Genes were divided in two classes based on H3K27me3 status in Ezh2ΔSET/ΔSET iPSC (H3K27me3+ genes in green, H3K27me3− genes in red) and compared to all genes (black) F. Gene ontology analysis of genes belonging to the three main groups based on H3K27 methylation status in Ezh2ΔSET/ΔSET iPSC depicted in panel A. Bars represent P-values in –Log2 scale of the corresponding biological processes. Dashed lines identify the significance threshold. G. Pie chart of H3K27 methylation status in Ezh2ΔSET/ΔSET iPSC of MEF specific genes marked by H3K27me3 in Ezh2 +/+ iPSC. Color code is shown in panel A.

