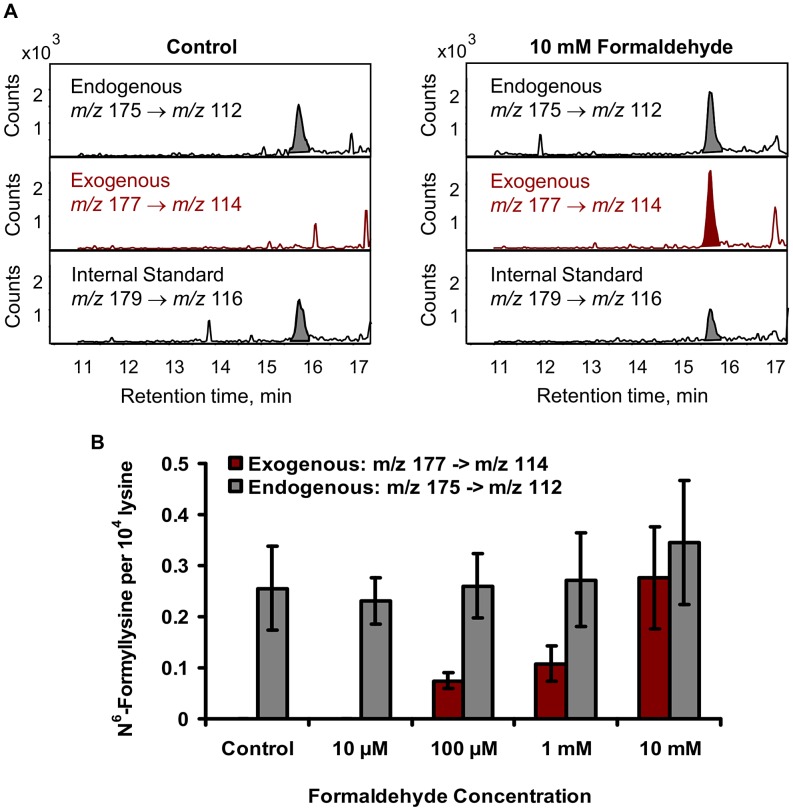
Figure 4. Addition of [13C,2H2]-formaldehyde to TK6 cells distinguishes exogenous from endogenous sources of N6-formyllysine.
(A) LC-MS/MS analysis showing signals for the three isotopomeric N6-formyllysine species, as described in Materials and Methods . (B) Plot of N6-formyllysine levels as a function of exposure to [13C,2H2]-formaldehyde. Data represent mean ± SD for N = 3.

