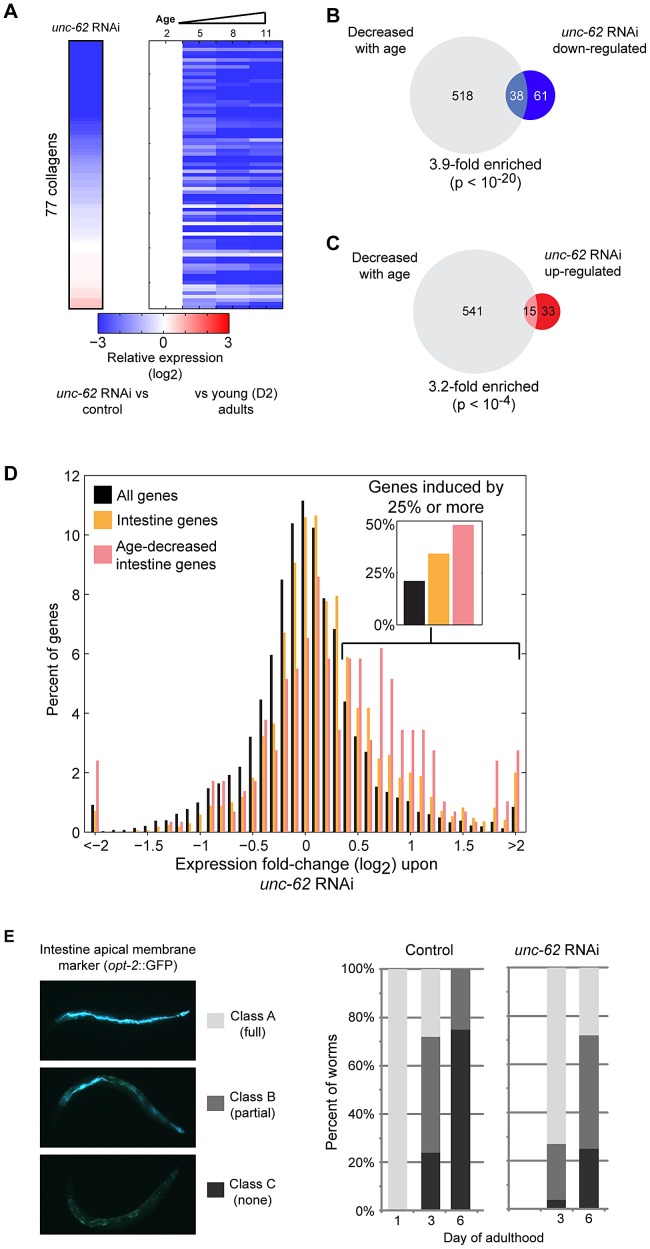
Figure 6. UNC-62 RNAi decreases expression of collagen genes and increases expression of intestinal genes.
(A) unc-62 RNAi decreases expression of collagen genes. Rows correspond to 77 collagen genes profiled in both our RNA-seq experiment as well as microarray studies of aging. Each row shows data for an individual collagen gene. (left) Color indicates RNA-seq fold-change between unc-62 RNAi and control, averaged from triplicate biological experiments. (right) The four columns indicate expression at day 2, 5, 8, and 11 from whole-worm microarrays (normalized to day 2 expression) (data from [10]). (B) Of the 99 genes down-regulated upon unc-62 RNAi (at 10% FDR) profiled by aging microarrays, 38 also decrease with age (3.9-fold enriched, p<10−20 by Fisher's exact test). (C) The 48 genes that increase in expression upon unc-62 RNAi (10% FDR) show a significant overlap with the 556 genes that decrease in expression with age (p<10−4) [10]. (D) unc-62 RNAi causes a broad increase in expression of intestinal genes. The histogram indicates the distribution of genes by average fold-change upon unc-62 RNAi. For 1699 genes with intestine-enriched expression [23], [33], [34] as well as the subset of 291 genes that also decrease expression with age [10], we determined the average mean-centered fold-change from triplicate RNA-seq experiments of unc-62 RNAi as compared to controls. Both intestine-enriched genes (orange) and intestine-enriched genes that decrease expression with age (pink) are significantly shifted towards increased expression upon unc-62 RNAi (p-value<10−20 by Kolmogorov-Smirnov test). (insert) The percent of genes with fold-change of 1.25 or more are indicated. (E) (left) An OPT-2:GFP reporter was used to measure intestinal morphology. In young adults, opt-2 localizes to the apical membrane of the intestine (class A). This structure deteriorates in older worms, as some worms contain the structure through only a portion of their body (class B) and others lack opt-2 expression altogether (class C). (right) Worms were placed on either unc-62 or control RNAi at day 1 of adulthood, and ∼30 worms for each were imaged and annotated at day 3 and day 6. Stacked bars indicate the percent of worms that were observed as class A (light grey), class B (dark grey), or class C (black).

