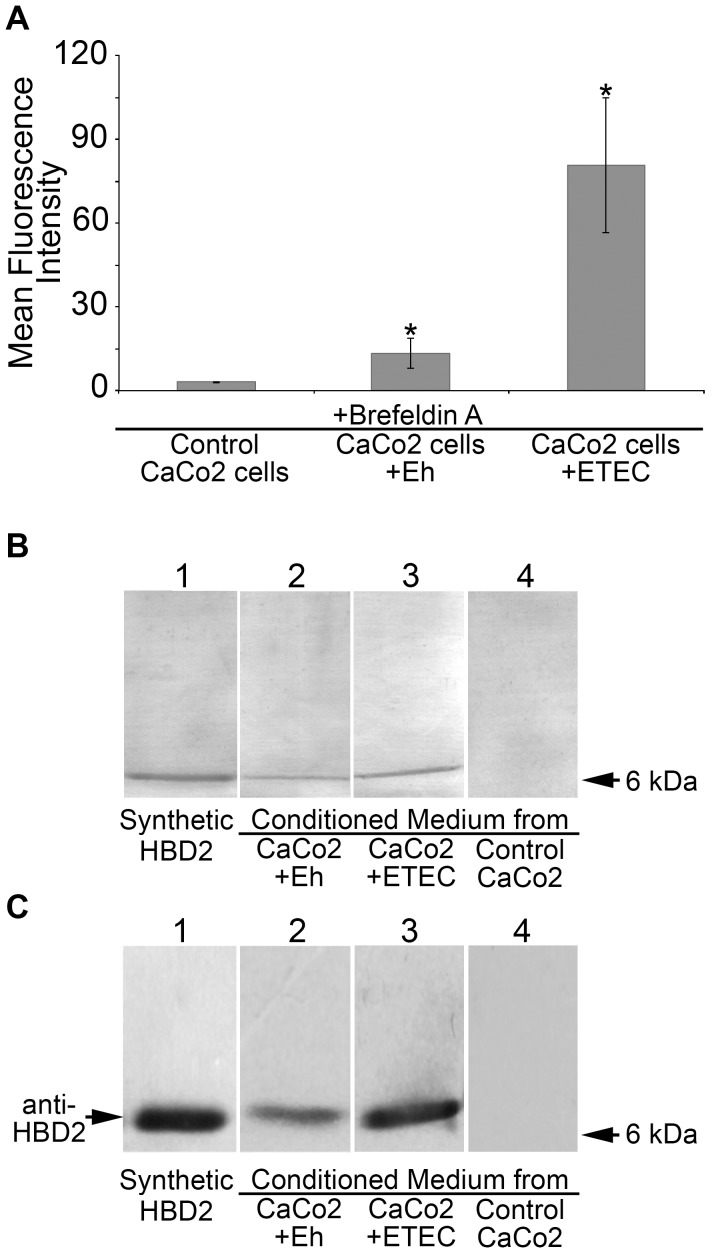
Figure 2. Production and release of HBD2 by CaCo2 cells exposed to Entamoeba histolytica trophozoites.
A. Quantification of HBD2-positive CaCo2 cells after exposure to pathogens. CaCo2 cells were exposed for 2 h to ETEC or PFA-fixed trophozoites in the presence of 1.0 µg/ml Brefeldin A. Cells were permeabilized and fixed and then labeled with a specific anti-HBD2 antibody tagged with FITC. Levels of HBD2 inside the CaCo2 cells were determined by flow cytometry and data are presented as mean fluorescence intensity (MFI). Asterisks indicate statistical differences relative to control CaCo2 cells in three experiments done in triplicate (P value<0.01). B. Detection of HBD2 in cultured media from CaCo2 cells. Culture media were analyzed by SDS-PAGE in 15% gels. A silver-stained representative gel is shown. Lane 1, synthetic HBD2 peptide. Lane 2, CM from CaCo2 cells exposed to PFA-fixed E. histolytica trophozoites (CaCo2+Eh). Lane 3, CM of ETEC-exposed CaCo2 cells (CaCo2+ETEC). Lane 4, CM from CaCo2 cells not exposed to pathogens (Control CaCo2). C. Immunodetection of HBD2 in a parallel gel to the one shown in panel B. After electrophoresis, proteins were blotted onto nitrocellulose membranes and challenged with anti-HBD2 antibody. Lane 1, synthetic HDB2 peptide. Lane 2, CM of CaCo2 cells exposed to PFA-fixed Entamoeba histolytica trophozoites (CaCo2+Eh). Lane 3, CM of CaCo2 cells exposed to ETEC (CaCo2+ETEC). Lane 4. CM of CaCo2 cell cultures not exposed to pathogens (Control CaCo2).

