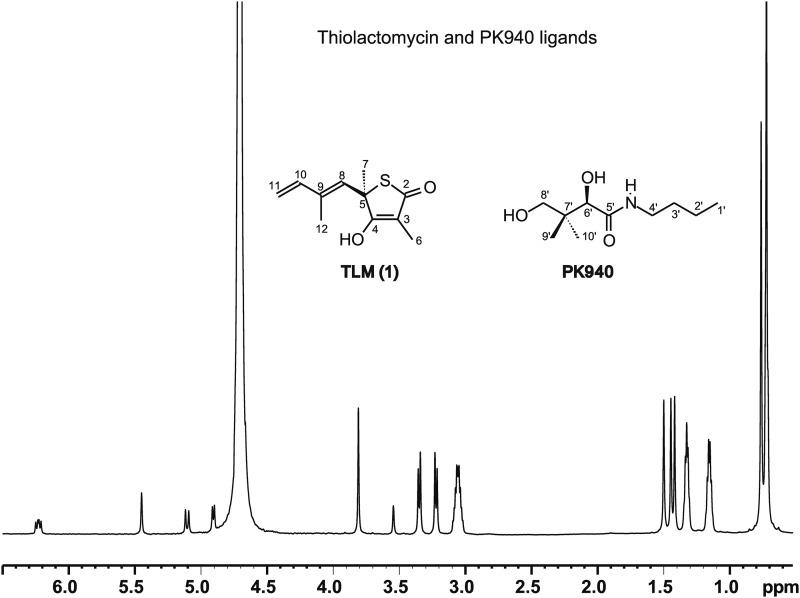
FIGURE 2.
1H NMR spectrum of TLM and PK940 in D2O at 700 MHz. TLM (1): 1H NMR (D2O) 6.23 (dd, 1H, H10), 5.45 (s, 1H, H8), 5.1 (d, 1H, H11, J = 18Hz), 4.9 (d, 1H, H11, J = 10.4 Hz), 4.7 (H2O), 1.50 (s, 3H, H7), 1.44 (s, 3H, H12), 1.41 (s, 3H, H6). The TLM methyls at positions 6, 7s and 12 are at 1.41, 1.50s and 1.44 ppms respectively. PK940: 1H NMR (D2O) 3.81 (s, 1H, H6′), 3.35 (d, 1H, H8′), 3.22 (d, 1H, H8′), 3.06 (dd, 2H, H4′), 1.32 (dd, 2H, H3′), 1.15 (dd, 2H, H2′), 0.75 (s, 3H, prochiral H9′/H10′), 0.714 (s, 3H, prochiral H9′/H10′), 0.708 (dd, 3H, H1′). Stacked doublet of doublets (H1′, 0.708 ppm) were resolved from geminal methyl peaks (H9′ and H10′, 0.714 and 0.75 ppm) by examining Heteronuclear Multiple-Quantum Correlation, Heteronuclear Multiple Bond Correlation data, and DPFGSE line shapes.

