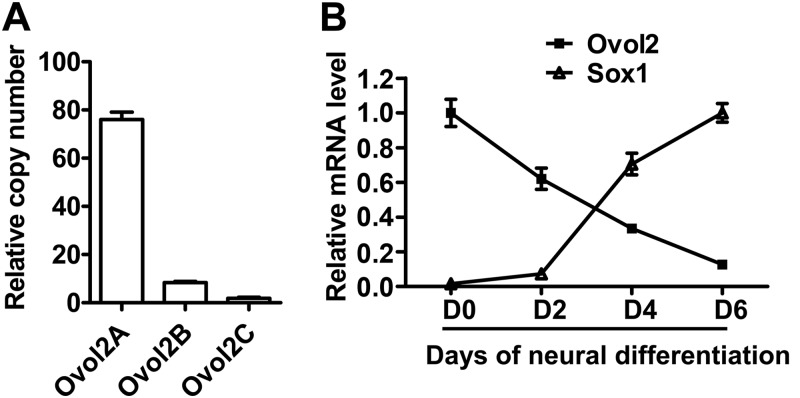
FIGURE 1.
Ovol2 expression decreases with the neural differentiation of ESCs. A, qRT-PCR quantification of the copy numbers of three splicing isoforms of Ovol2 in ESCs. Values shown are the copy numbers for Ovol2A, Ovol2B, and Ovol2C in a 1-μl cDNA sample from ESC culture. B, qRT-PCR analysis of Ovol2 and Sox1 mRNA levels during ESC neural differentiation. ESCs were cultured in the SFEB condition for 6 days and subjected to analysis at differentiation day 0, 2, 4, and 6. For qRT-PCR analysis in all of the following experiments, the expression levels of Ovol2 and Sox1 were normalized to that of Gapdh, and the peak value for each gene was designated as 1, respectively. Error bars, S.E.

