FIGURE 2.
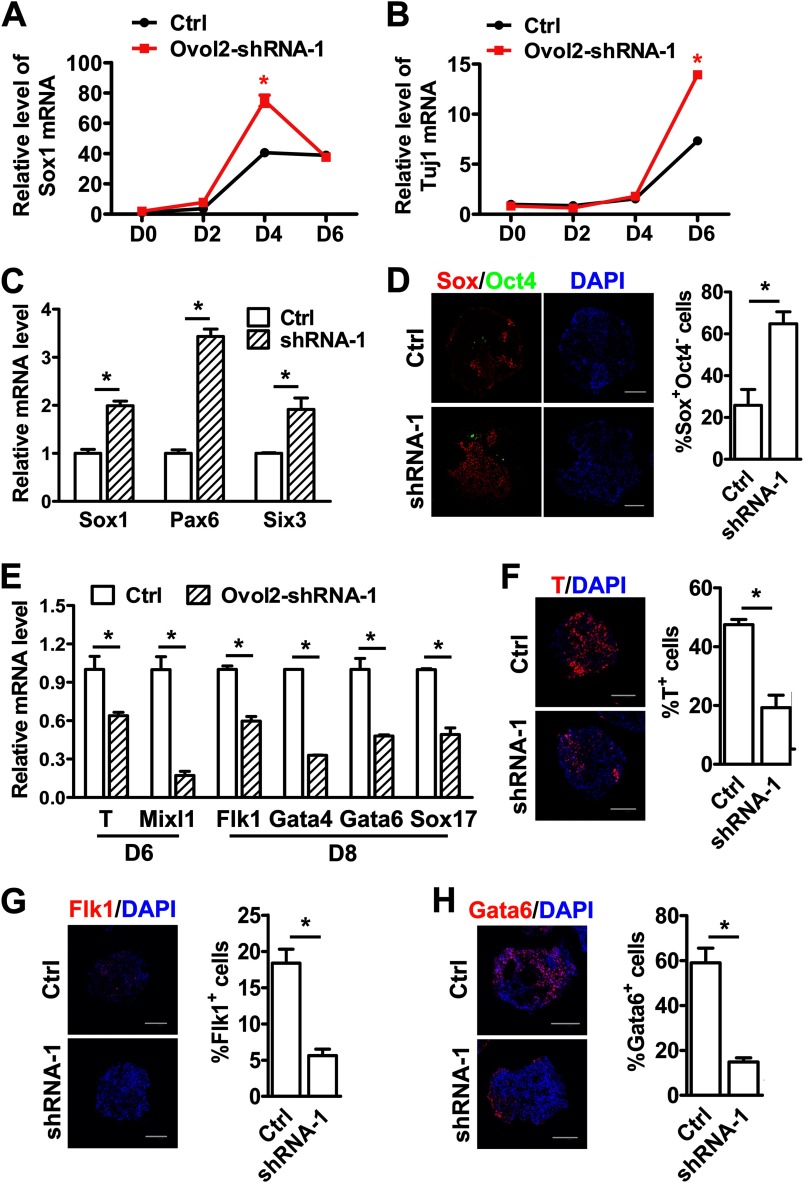
Knockdown of Ovol2 facilitates ESC neural conversion and impairs mesendodermal differentiation. A and B, control ESCs (Ctrl) or Ovol2 shRNA ESCs were induced in the SFEB condition for 6 days. The expression levels of Sox1 (A) and Tuj1 (B) at differentiation days 0, 2, 4, and 6 were analyzed by qRT-PCR and normalized to the expression of Gapdh. The value for each gene in day 0 control ESCs was designated as 1. C, EBs from control ESCs or Ovol2 shRNA ESCs were cultured in unbiased differentiation medium for 8 days. The expression levels of Sox1, Pax6, and Six3 were analyzed by qRT-PCR and normalized to the expression of Gapdh. The values for each marker in control EBs were designated as 1, respectively. D, double immunostaining for Sox (red) and Oct4 (green; artificial color) proteins in day 8 EBs cultured under the conditions described in C. For EB staining in all of the following experiments, sections from thousands of EB aggregates were stained, and statistical analysis were performed. Nuclei were stained with DAPI (blue). The diagram beside the images shows the percentage of Sox+Oct4− cells in the EBs. E, the expression levels of T and Mixl1 in day 6 EBs and of Flk1, Gata4, Gata6, and Sox17 in day 8 EBs cultured under the conditions described in C were analyzed by qRT-PCR. F–H, immunostaining for T in day 6 EBs (F), Flk1 (G), and Gata6 (H) in day 8 EBs. The percentages of T+, Flk1+, and Gata6+ cells were shown in the diagrams beside the images. Scale bar for all of the images, 100 μm. Error bars, S.E.

