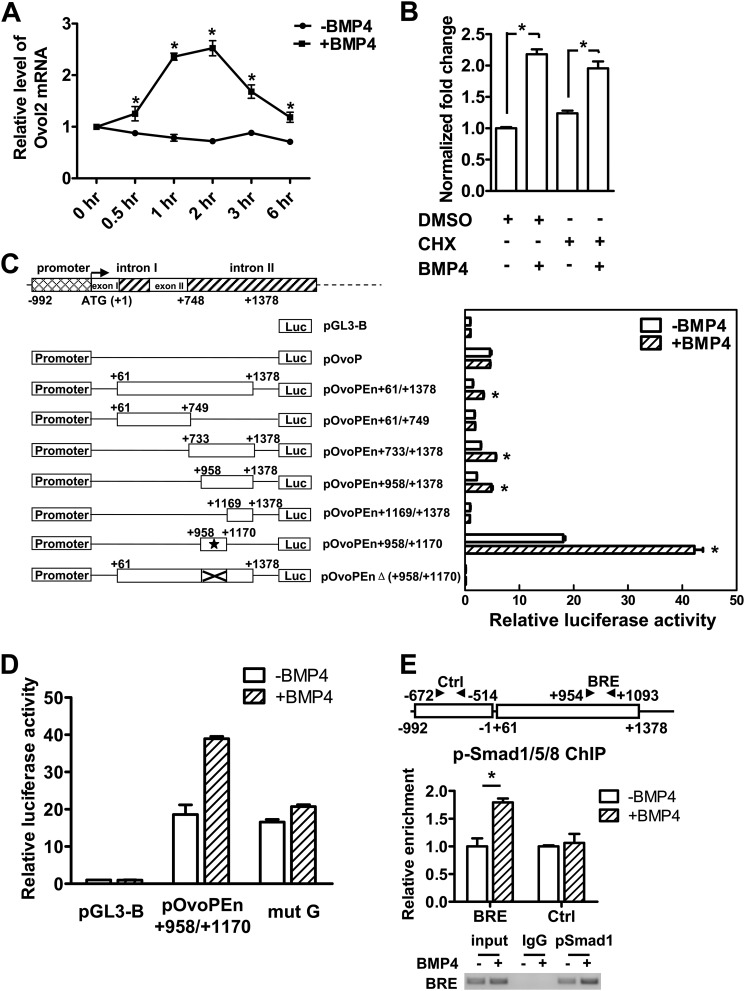
FIGURE 6.
Ovol2 is directly regulated by BMP4. A, serum-starved ESCs were stimulated with BMP4 (10 ng/ml) for the indicated lengths of time, after which the cells were harvested for qRT-PCR analysis of Ovol2 expression. The value in the untreated ESCs was designated as 1. B, serum-starved ESCs were pretreated with cyclohexamide (CHX) for 4 h and then stimulated with BMP4 in the presence of cyclohexamide for 2 h, after which cells were harvested for qRT-PCR analysis for Ovol2. The value in the mock-treated ESCs was designated as 1. C, the localization of the minimal enhancer region in the Ovol2 gene. P19 cells were transiently transfected with constructs as indicated in the left panel for 24 h and serum-starved for 12 h, followed by treatment with or without BMP4 (10 ng/ml) for 6 h, and then the luciferase activity was determined. The activity of each construct was shown relative to that of the pGL3-Basic vector. The minimal enhancer region is indicated by an asterisk. D, P19 cells were transfected with pGL3-Basic, pOvoPEn+958/+1170, and site-mutated construct (mut G), respectively, and treated as described in C, and the luciferase activity was determined. E, ChIP assay of the p-Smad1/5/8 binding on Ovol2 enhancer. P19 cells were transiently transfected with pOvoPEn+61/+1378 for 24 h, serum-starved for 12 h, and then stimulated with BMP4 (10 ng/ml) (+BMP4) or mock (−BMP4) for 2 h before the cells were harvested for the ChIP assay. An antibody against p-Smad1/5/8 (Cell Signaling) was used, and the immunoprecipitates were analyzed by quantitative PCR for enrichment of Ovo-BRE and the control region (Ctrl). The data were normalized to the inputs and are represented as one of three independent experiments. The electrophoresis image of the ChIP product is also shown. Error bars, S.E.

