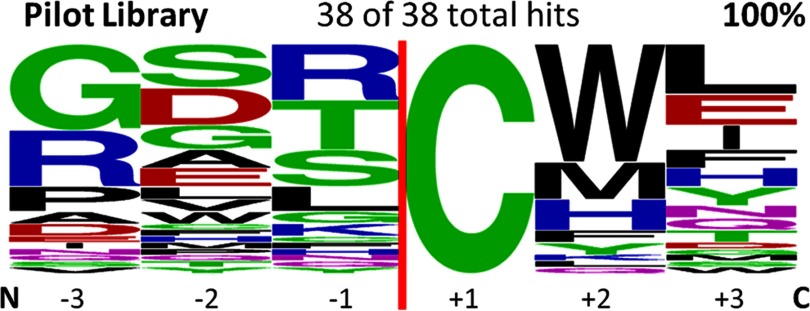
FIGURE 5.
Logo diagram of flanking extein sequences identified in the low stringency pilot study with the native KanR RBS reveals expanded specificity at the +2 and +3 positions. This figure was made using the Weblogo program (28) and shows 38 randomly chosen positive hits selected for splicing of the Npu DnaE intein in KanR site C. This construct results in expression of more KanR protein than needed for resistance and, therefore, allows selection of precursors that splice slowly or with a low percentage of spliced product (data not shown). The vertical red line indicates the position of the intein. The +1 position was fixed as Cys.

