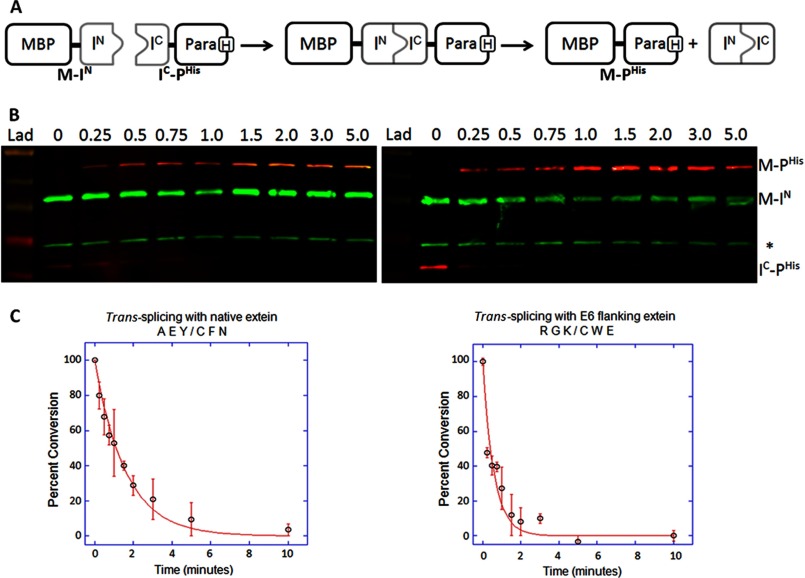
FIGURE 6.
Kinetic analysis of trans-splicing inteins with selected flanking extein sequences. A, shown is a schematic representation of the trans-splicing reaction. The N-terminal precursor fragment (M-IN) consists of the maltose binding protein (M or MBP) followed by a short linker, three native or selected extein residues, and the N-terminal half of the Npu DnaE intein (IN: residues 1–102). The C-terminal precursor fragment (IC-PHis) consists of the C-terminal half of the Npu DnaE intein (IC; residues 103–138), three native or selected extein residues, a short linker, the ΔSal fragment of paramyosin (P) and a C-terminal His tag. M-IN and IC-PHis spontaneously assemble when mixed resulting in intein activation and protein splicing. Any unreacted precursor complex and the IN-IC product complex dissociate during SDS-PAGE sample preparation. B, Western blots show the time course of trans-splicing with native (Ala-Glu-Tyr/Cys-Phe-Asn, left panel) or E6 (Arg-Gly-Lys/Cys-Trp-Glu, right panel) flanking extein residues. Time points from 0 to 5 min are listed across the top of each blot. The nitrocellulose membranes were simultaneously probed with mouse IgG anti-His tag antibody and rabbit anti-MBP antiserum followed by detection with LI-COR IRDye 680 goat anti-mouse (red) and IRDye 800 goat anti-rabbit secondary antibodies (green). The band labeled M-PHis was quantified to measure the rate of spliced product formation. The asterisk marks endogenous E. coli MBP. Lane Lad contains the NEB prestained broad range (10–230 kDa) ladder. C, shown are plots of the percent conversion of precursor to product during the trans-splicing time courses with native (left panel) or E6 (right panel) flanking extein residues. The red line represents the fit of the data to a first order decay reaction, and the S.D. is indicated by the error bars.

