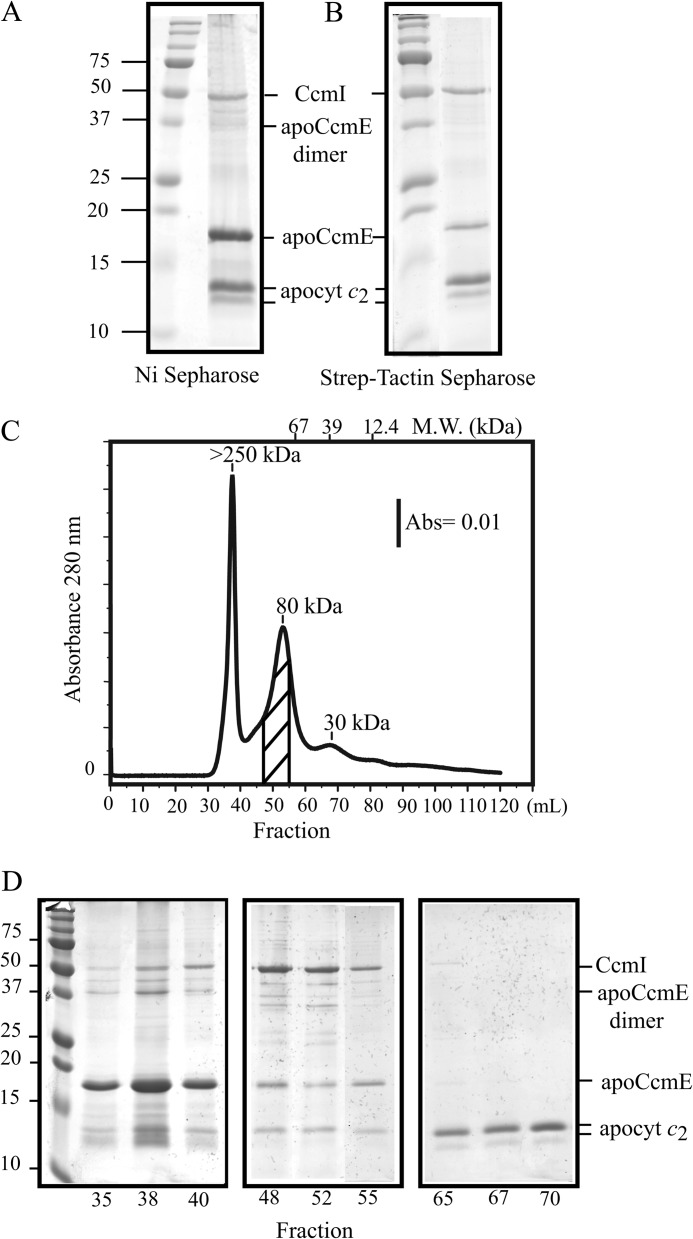
FIGURE 6.
ApoCcmE forms a ternary complex with CcmI and apocytochrome c2. A, co-purification of FLAG-CcmI and Strep-apocytochrome c2 with His-apoCcmE using Ni2+-Sepharose resin is shown. B, co-purification of FLAG-CcmI and His-apoCcmE with Strep-apocytochrome c2 using Strep-Tactin-Sepharose resin is shown. C, shown is an elution profile (absorbance at 280 nm as a function of the volume) of a mixture containing His-apoCcmE, FLAG-CcmI, and Strep-apocytochrome c2 from the Sephacryl S200 column in buffer containing 0.01% DDM. Estimation of the molecular masses (kDa) was done according to the calibration of the column using bovine serum albumin (67 kDa), carbonic anhydrase (39 kDa), and horse heart cytochrome c (12.4 kDa). Elution volume of the different standards and their respective molecular masses are depicted on the top of the chromatogram. The area of the chromatogram where FLAG-CcmI, His-apoCcmE, and Strep-apocytochrome c2 are co-eluted as a ternary complex is highlighted with diagonal lines. D, SDS-PAGE profiles of selected fractions are shown. Fractions 35–40 (left panel) and 65–70 (right panel) contain mainly aggregates of apoCcmE and apocytochrome c2, respectively, and fractions 48, 52, and 55 contain the quasi-stoichiometric ternary complex composed of FLAG-CcmI, His-apoCcmE, and Strep-apocytochrome c2, as indicated on the right. Note that proteins with higher molecular masses (e. i., CcmI) stained more intensely with Coomassie Blue as compared with smaller proteins (i.e. apoCcmE and apocytochrome c2).

