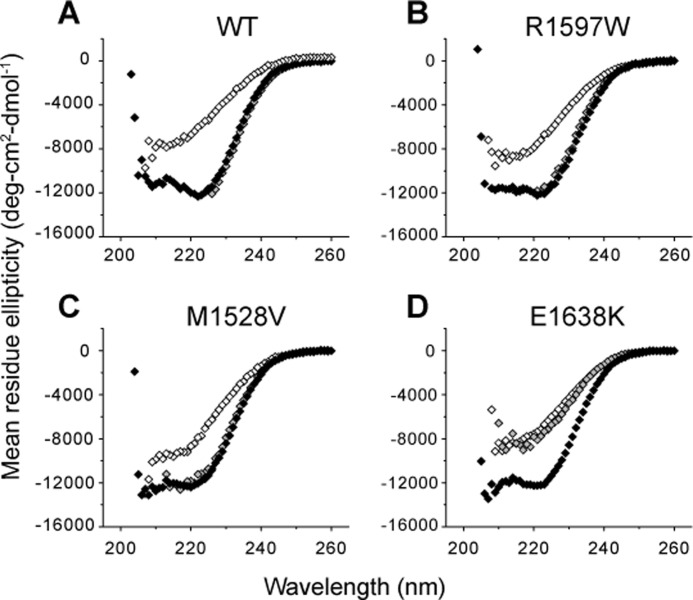
FIGURE 4.
CD spectra of VWD A2. Under physiologic calcium concentrations, all VWD mutants exhibited similar native spectra compared with wild-type at 4 °C (black). At 90 °C (white), the spectra lost α-helical signature. Upon removal of calcium with 1 mm EDTA at 4 °C (gray), wild-type, R1597W, and M1528V retained and E1638K lost α-helical content.

