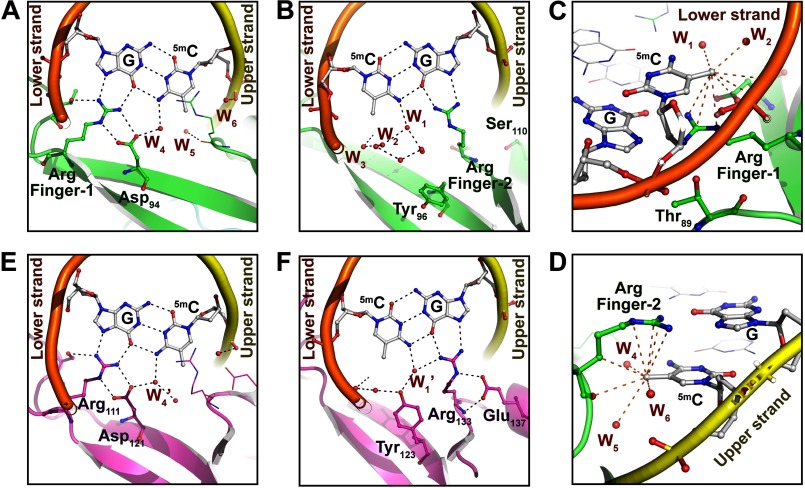
FIGURE 3.
Structural comparison of DNA binding surfaces of MBDMBD4 and MBDMeCP2. A and B, recognition of the 5mCG site by Arg finger-1 (A) or Arg finger-2 (B) of MBDMBD4. Hydration water molecules are represented as small red spheres. DNA backbone structures of the upper and lower strands are depicted as yellow and orange tubes, respectively. Black dotted lines indicate hydrogen bonds (<3.2 Å). C, recognition of the methyl group of 5mC in the lower strand by MBDMBD4. Orange dotted lines indicate nonbonded contacts with the 5-methyl group of 5mC (<4.2 Å). D, recognition of the 5-methyl group of the lower strand 5mC by MBDMBD4. The red spheres labeled as W1–6 in A–D represent the water molecules in the coordinate file of the MBDMBD4-5mCG/5mCG complex structure (PDB code 3VXX); W1, Wat-202 in chain C; W2, Wat-312 in chain A; W3, Wat-319 in chain A; W4, Wat301 in chain A; W5, Wat-214 in chain B; W6, Wat-202 in chain B. E and F, recognition of the 5mCG site by Arg finger-1 (E) or Arg finger-2 (F) of MBDMeCP2 (21). Black dotted lines indicate hydrogen bonds. W1′ and W4′ indicated in E and F correspond to the water molecules in the MeCP2-DNA complex structure (PDB code 3C2I), Wat-32 in chain B and Wat-183 in chain A, respectively.

