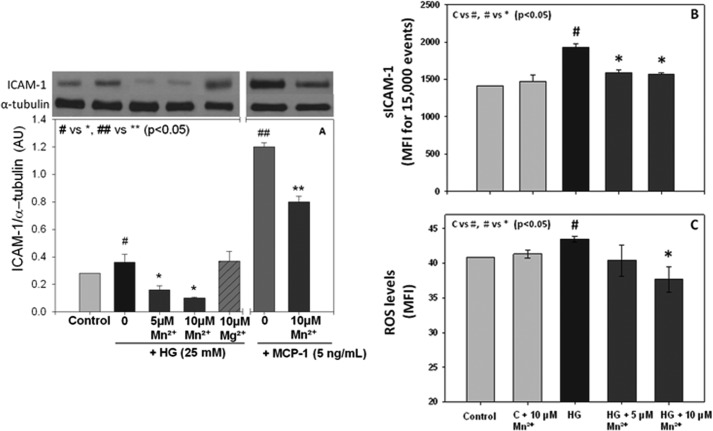
FIGURE 3.
Effects of Mn2+ supplementation on ICAM-1 total expression (A), surface expression (B), and ROS (C) in HUVECs. Quantification of band intensity is shown in arbitrary units (AU). Values are ± S.E., n = 3, expressed as mean fluorescence intensity (MFI) for surface ICAM-1. Values are ± S.E., n = 4 for ROS. C indicates control.

