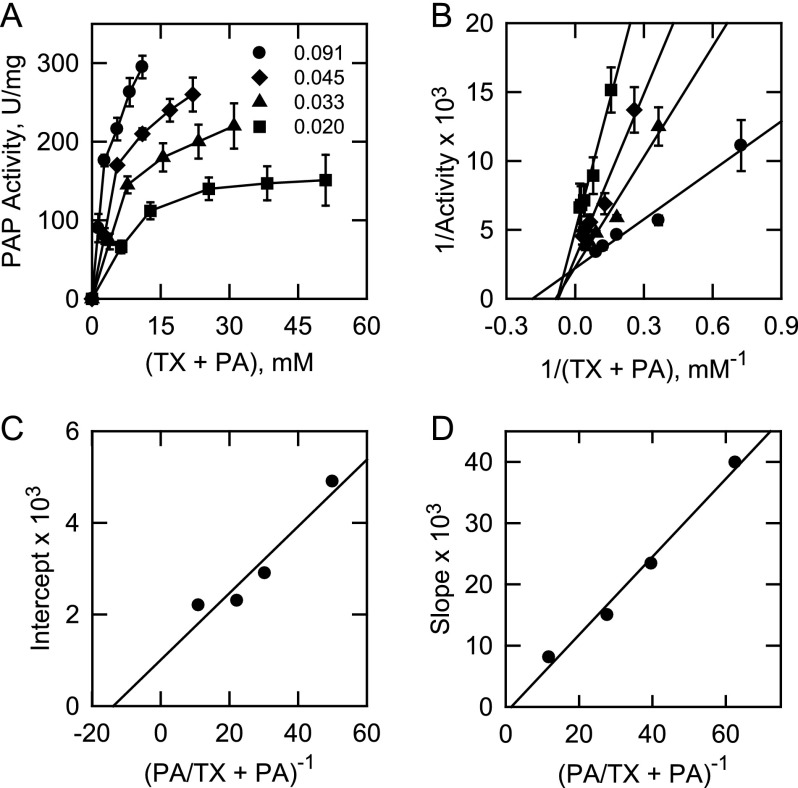
FIGURE 7.
App1p PAP activity follows surface dilution kinetics with Triton X-100/PA-mixed micelles. A, PAP activity was measured as a function of the sum of the molar concentrations of Triton X-100 (TX) + PA at the indicated set mol fractions of PA. B, double reciprocal plot of the data in A. C, replot of the 1/activity intercepts obtained in B versus the reciprocal of the mol fraction of PA. D, replot of slopes obtained in B versus the reciprocal of the mol fraction of PA. The data shown in A are means ± S.D. (error bars) from triplicate enzyme determinations. The lines drawn in B–D are a result of a least-squares analysis of the data.

