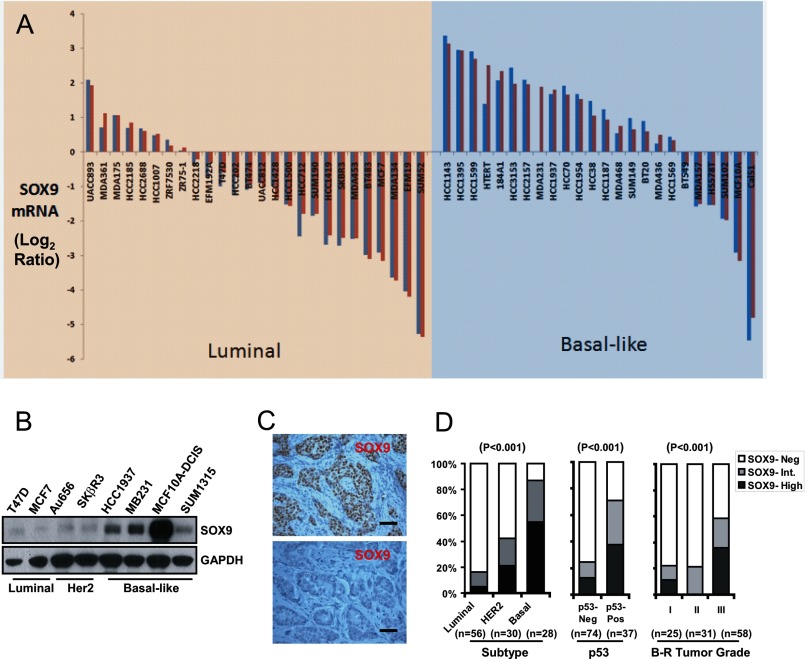
FIGURE 1.
SOX9 expression in BCa. A, a waterfall chart of SOX9 expression in various BCa cell lines was adapted from a published database (35). The SOX9 mRNA expression level is shown as the log2 ratio of R/G, where R is the red probe signal of RNA from each individual cell line and G is the green probe signal of pooled RNA from 11 human cell lines. SOX9 mRNA levels measured by one or two independent probes were plotted. B, immunoblotting of SOX9 in BCa cell lines subgrouped according to published gene profiling, with GAPDH as a protein loading control. C, representative immunohistochemical staining of SOX9 in primary BCa tissue microarrays, demonstrating SOX9 high (upper panel) or negative (bottom panel) staining patterns. Bars, 50 μm. D, the percentage of SOX9-negative (Neg), intermediate (Int.), and high cases were compared among BCa subtypes (left panel); between negative or positive p53 immunostaining groups (middle panel); or among Bloom-Richardson (B-R) tumor grade groups (right panel). The p values of the difference analysis (Fisher's Exact Test) are indicated.

