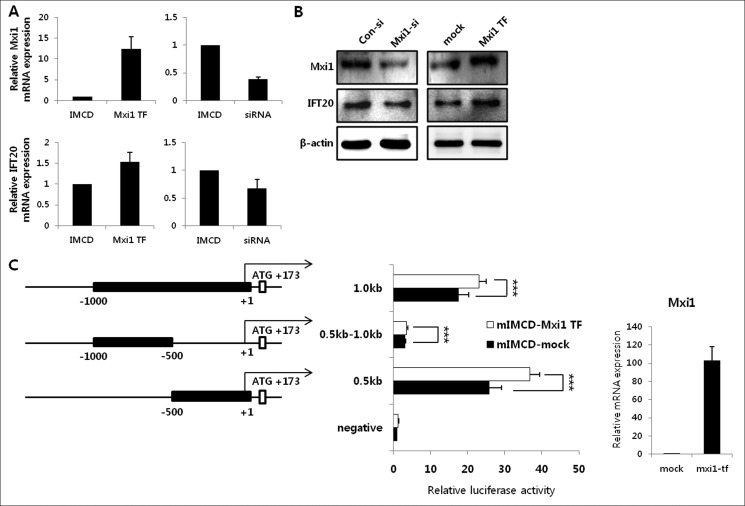
FIGURE 5.
Influence of Mxi1 on Ift20 expression and its promoter activity. A, verification of Mxi1 and Ift20 mRNA expression in mIMCD-3 cells (controls), Mxi1 transiently overexpressed mIMCD-3 cells, and Mxi1 siRNA-treated mIMCD-3 cells. The graphs show mean ± S.D. (error bars) in triplicate. B, Western blot of Ift20 and Mxi1 level in Mxi1 siRNA-treated mIMCD-3 cells and Mxi1 transiently overexpressed mIMCD-3 cells compared with that in their respective controls. β-Actin was used as a loading control. C, deletion constructs of the Ift20 5′-flanking region and luciferase activity in mIMCD-3 and Mxi1 transiently overexpressed mIMCD-3 cells. The representative graph shows mean ± S.D. of three independent assays. ***, p < 0.005. The right part of the luciferase assay shows Mxi1 mRNA expression in Mxi1 transiently overexpressed mIMCD-3 cells compared with that in control used in this luciferase assay. The graph shows mean ± S.D. in triplicate.

