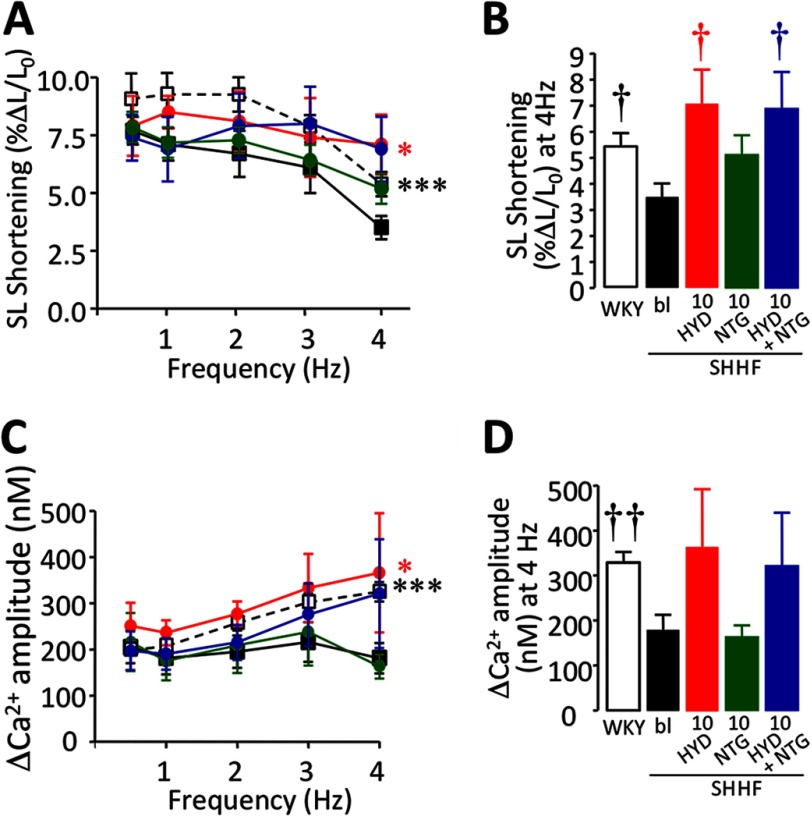
FIGURE 7.
SL shortening and Ca2+ transient amplitude-frequency response in SHHF cardiomyocytes. A, FFR in SHHF rat CMs in the absence (■) or presence of 10 μm HYD (red ●), 10 μm NTG (green ●), or a combination (HYD + NTG, 10 μm each; blue ●) compared with WKY control CMs (□). B, bar graph showing contractility data at 4 Hz. C, Ca2+-FFR in SHHF rat CMs treated with 10 μm HYD or 10 μm NTG or their combination (HYD + NTG, 10 μm each). D, bar graph showing Δ[Ca2+]i data at 4 Hz. In SHHF CMs, similar effects to those observed in NOS1−/− were obtained with these treatments (n = 5–15 cells). *, p < 0.05; ***, p < 0.001 versus SHHF control; two-way ANOVA. †, p < 0.05; ††, p < 0.01 versus SHHF control, Student's t test.

