FIGURE 2.
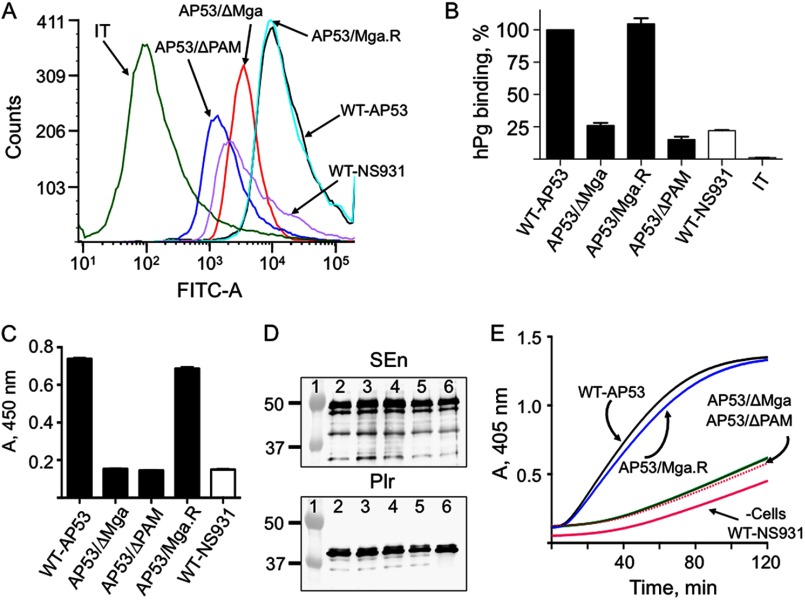
Binding and activation of hPg to GAS cells. A, binding of hPg to the indicated strains of GAS was examined by FCA. Cells of each GAS line (1 × 10⁷ cfu) were incubated with hPg (20 μg/ml). Mouse anti-human Pg was added, followed by AlexaFluor488 goat anti-mouse IgG. The cells were then resuspended in PBS, 1% paraformaldehyde for FCA. FCA histograms for each of the cell lines are shown at 488 nm, with gating on side scatter (SSC-H) and fluorescence (FITC-A), using logarithmic amplification. The cell suspensions were analyzed at a flow rate of 10 μl/min with 10,000 events used for analysis. IT represents the antibody isotype control. B, % binding of hPg calculated from A. The hPg binding to WT-AP53 was taken as 100%; the binding by other strains was calculated using the Median statistical value provided from analysis of each FCA histogram by FCS Express version 4 software. C, hPg binding measured by ELISA. Cells (∼2 × 10⁷ cfu) from log phase growth (A600 nm ∼0.6) of the indicated strains of GAS were added to individual wells of 96-well microtiter plates. Next, hPg was added, followed sequentially by rabbit anti-human Pg and HRP-conjugated goat anti-rabbit IgG, with washes between additions. After addition of the HRP substrate TMB, for 20 min, the reaction was terminated with 2 m H2SO4, and the A405 nm was determined and plotted directly. D, SEn and Plr expression detected by Western blot analysis of whole cell extracts of each cell line. The A280 nm was adjusted to 0.3, and 10 μl was applied to each lane. The antibodies employed were anti-SEn (top) and anti-Plr (bottom). Lane 1, molecular weight markers; lane 2, WT-AP53; lane 3, AP53/ΔPAM; lane 4, AP53/ΔMga; lane 5, AP53/Mga.R; lane 6, WT-NS931. E, cells of the GAS strains indicated were grown to A600 nm ∼0.6 in 10 mm Hepes, 150 mm NaCl, pH 7.0. Aliquots of cells (1 × 10⁷ cfu) were added to individual wells of 96-well low protein binding microtiter plates. hPg was then added followed by a solution containing 5 nm r-SK2b/0.25 mm S-2251. The A405 nm was continuously monitored using a plate reader. The data were collected at room temperature. The red line, represented as −Cells, is a control activation in the absence of cells and is very similar to the activation rate seen with WT-NS931 cells. There was no difference in the curves when E64 was placed in the cell growth medium and the assay.

