FIGURE 5.
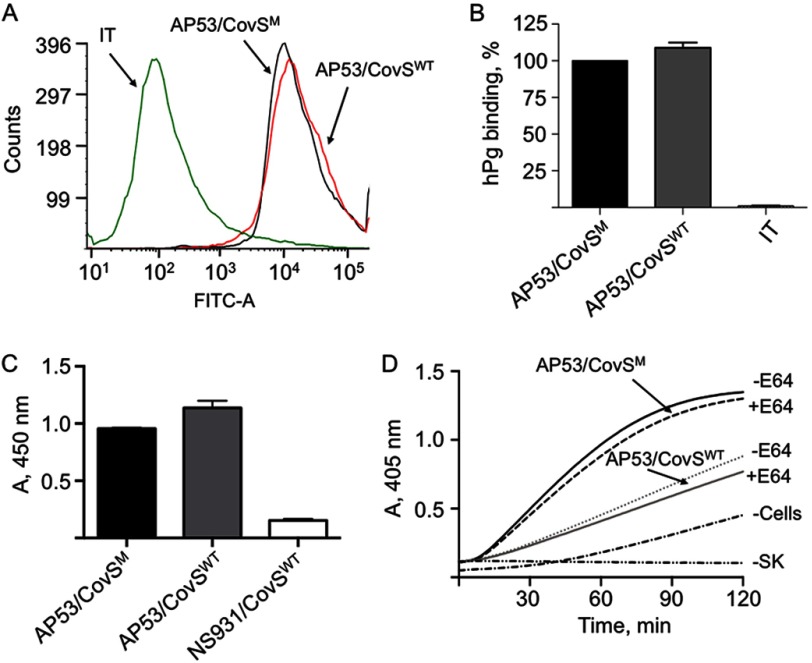
Effect of the CovSM on functional expression of PAM. A, binding of hPg to AP53/CovSM (WT-AP53) cells and AP53/CovSWT cells as assessed with FCA. Cells (1 × 10⁷ cfu) were incubated with hPg (20 μg/ml). Mouse anti-human Pg was added, followed by AlexaFluor488 goat anti-mouse IgG. The cells were then resuspended in PBS, 1% paraformaldehyde for FCA. FCA histograms for each of the cell lines are shown at 488 nm, with gating on side scatter (SSC-H) and fluorescence (FITC-A), using logarithmic amplification. The cell suspensions were analyzed at a flow rate of 1 ml/s with 10,000 events used for analysis. IT represents the antibody isotype control. B, % binding of hPg to AP53/CovSWT cells, relative to hPg binding to AP53/CovSM set at 100%, was calculated using the median statistical value provided from analysis of each FCA histogram by FCS Express version 4 software. C, cells (∼2 × 10⁷ cfu) of the indicated strains of GAS were added to individual wells of 96-well microtiter plates. Next, hPg was added, followed sequentially by rabbit anti-human Pg and then HRP-conjugated goat anti-rabbit IgG. After addition of the HRP substrate TMB for 20 min, the reaction was terminated with 2 m H2SO4, and the A450 nm was determined. D, cells (1 × 10⁷ cfu) were added to individual wells of 96-well low protein binding microtiter plates. hPg was then added followed by a solution containing 5 nm r-SK2b/0.25 mm S-2251. The A405 nm was continuously monitored on a plate reader. The data were collected at room temperature. The lines represented as −Cells and −SK are control activations in the absence of cells and SK, respectively. All cells were presented at mid-log phase growth (A600 nm ∼0.6). Assays were performed both in the absence (−E64) and presence (+E64, 28 μm) of the aSpeB inhibitor, E64, in each cell line during cell growth and during the hPg activation assay.

