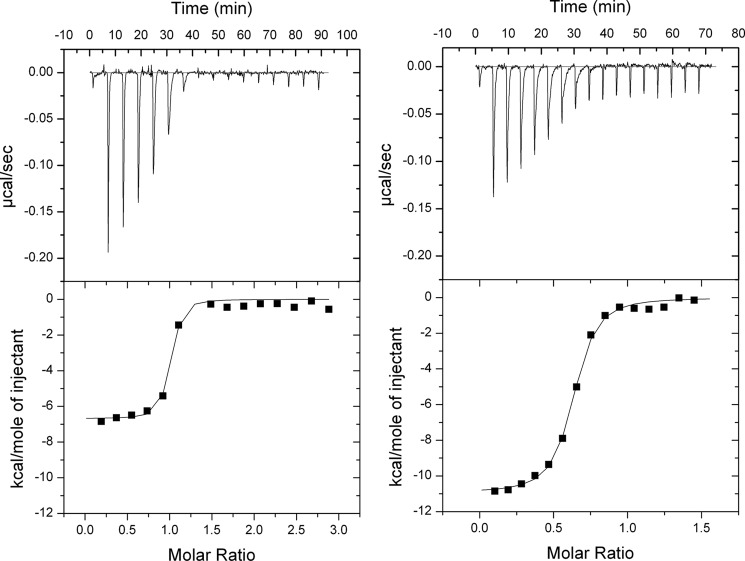
FIGURE 4.
ITC of digoxin and digoxigenin binding to phosphorylated Na,K-ATPase. Shown is a series of 2.4-μl sequential single injections of digoxin (150 μm) (A) and digoxigenin (300 μm) (B) into shark Na,K-ATPase (20 μm). The experiments were conducted at 25 °C in a medium containing 10 mm imidazole-HCl (pH 7.0), 3 mm MgCl2, 3 mm Pi-Tris, and 25% glycerol. The top panels show the power (μcal·s−1) that needs to be applied to the sample cell to maintain isothermal conditions relative to the reference cell. Integrations of the individual peaks yield the apparent enthalpy change of the binding reaction, which is depicted in the bottom panels as a function of the CTS/Na,K-ATPase molar ratio. Fitting of the data (curves in the bottom panels) with a one-site binding model gave the following parameters. A, digoxin: ΔH298 = −45.8 ± 0.6 kJ·mol−1, K = 5.3·106 ± 0.7·106 m−1, ΔS298 ≅ −25 J·K−1·mol−1, and n = 0.60 ± 0.01. B, digoxigenin, ΔH298 = −28.0 ± 0.7 kJ·mol−1, K = 15.4·106 ± 0.7·106 m−1, ΔS298 ≅ 44 J·K−1·mol−1, and n = 0.93 ± 0.03.

