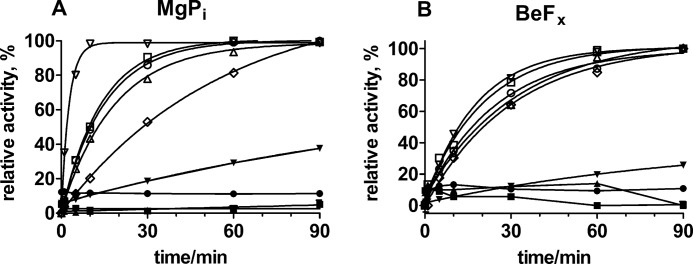
FIGURE 5.
Reactivation of enzyme with 150 mm NaCl after inhibition by CTS at pH 7.5. A and B, reactivation after CTS binding to enzyme phosphorylated by MgPi (A) and in the E2-P ground state stabilized by BeFx (B), respectively. The reactivation is given relative to the maximum reactivation obtained for each CTS compound. ▿, gitoxigenin (40 μm); ○, ouabagenin (100 μm); □, digitoxigenin (10 μm); ▵, digoxigenin (15 μm); ♢, bufalin (10 μm). The closed symbols are the glycosylated compounds (all at 10 μm). The data for the aglycones are fitted with monoexponentials given by the curves, with the following observed rate constants in A: gitoxigenin, kobs = 6.18 ± 0.42·10−3 s−1; ouabagenin, kobs = 1.10 ± 0.02·10−3 s−1; digitoxigenin, kobs = 1.20 ± 0.03·10−3 s−1; digoxigenin, kobs = 0.90 ± 0.03·10−3 s−1; bufalin, kobs = 0.30 ± 0.02·10−3 s−1. In B, the observed rate constants are as follows: gitoxigenin, kobs = 0.95 ± 0.03·10−3 s−1; ouabagenin, kobs = 0.52 ± 0.02·10−3 s−1; digitoxigenin, kobs = 0.80 ± 0.02·10−3 s−1; digoxigenin, kobs = 0.67 ± 0.02·10−3 s−1; bufalin, kobs = 0.55 ± 0.02·10−3 s−1.

