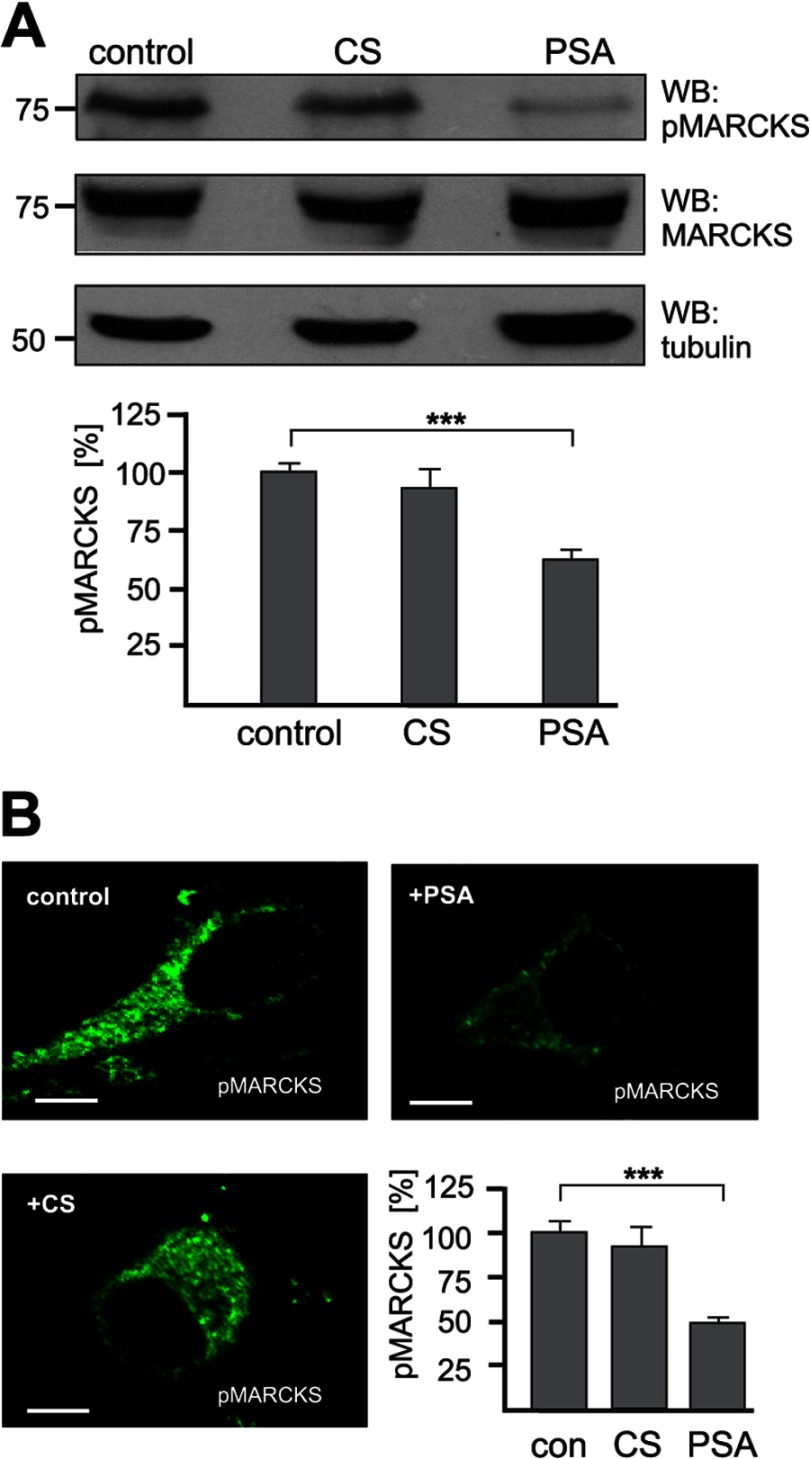
FIGURE 5.
Reduction of the level of phosphorylated MARCKS by PSA. A and B, primary hippocampal neurons were incubated without (control) or with chondroitin sulfate (CS) or colominic acid (PSA). A, neurons were lysed with RIPA buffer and probed by Western blot (WB) analysis with an antibody against phosphorylated MARCKS (pMARCKS), total MARCKS, and tubulin as loading control (upper panel). Band intensities were quantified by densitometry. The levels of pMARCKS in the presence of colominic acid or chondroitin sulfate relative to the levels obtained in their absence, which was set to 100%, are shown (lower panel). Mean values ± S.E. (n = 3) are shown (***, p < 0.001, paired Student's t test). B, neurons were immunostained with an antibody against phosphorylated MARCKS. Representative images of neurons and the quantification of the fluorescence intensity are shown. The levels of pMARCKS in the presence of colominic acid or chondroitin sulfate relative to the levels obtained in their absence (set to 100%) are shown (lower panel). Mean values ± S.E. of 10 cells per group are shown (***, p < 0.001, paired Student's t test). The scale bar represents 5 μm.

