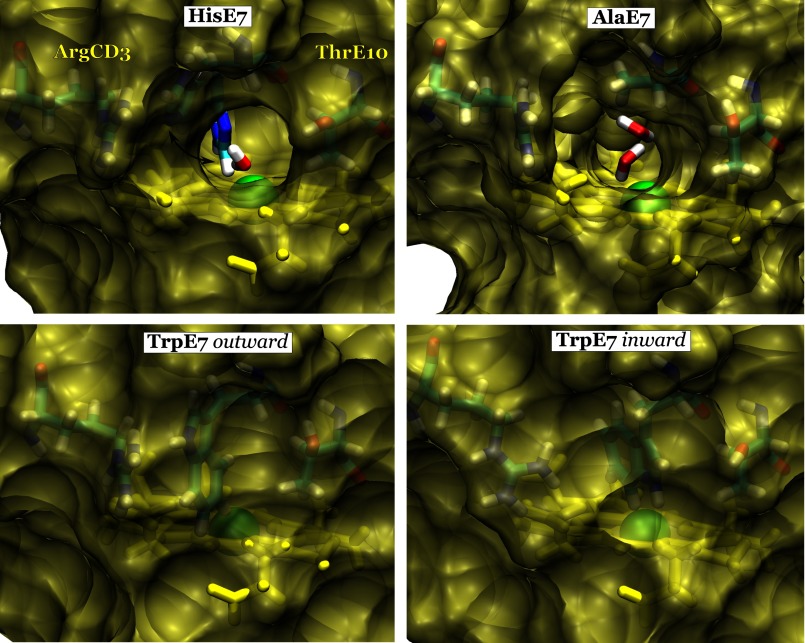
FIGURE 3.
Solvent-accessible surface contour of the E7 pathway. The surface of wt Mb (top left panel) is shown with His-E7 in the open conformation with the closed His-E7 conformation superimposed in a stick representation for reference. Surface representations of mutants Ala-E7 Mb (top right panel), Trp-E7 in the outward conformation (bottom left panel) and Trp-E7 in the inward conformation (bottom right panel) are also shown. Clear tunnels for ligand migration can be seen in the open His-E7 conformation (top left) and in the Ala-E7 (top right) mutant, both of which can be occupied by water molecules (shown as sticks). The heme group (yellow), iron atom (green), and nearby residues (cyan) are depicted in each panel.

