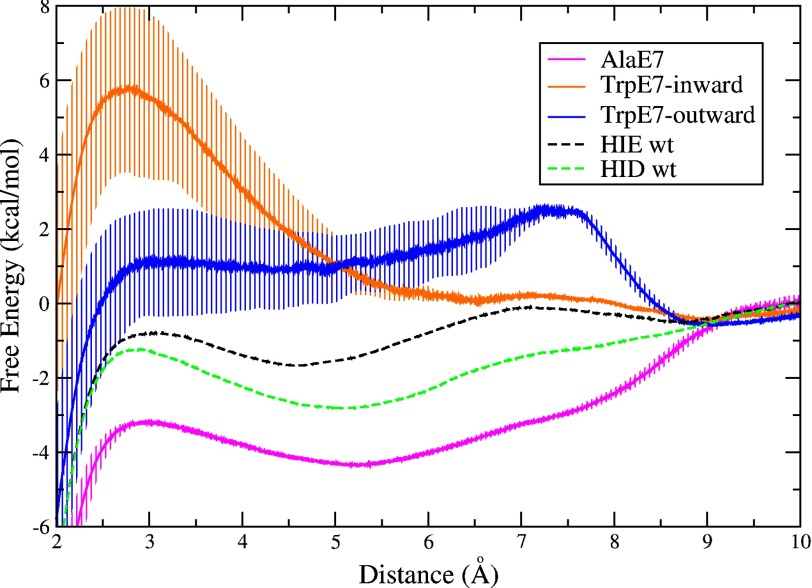
FIGURE 7.
Free energy profile of ligand migration through the E7 pathway for mutant proteins: Ala-E7 Mb (magenta curve), Trp-E7 Mb in the outward conformation as found in the crystal structure (blue curve) and Trp-E7 Mb in the inward conformation adopted during the simulation (orange curve). The free energy was set to a value of 0 at 10 Å, where the oxygen molecule is fully solvated. Error bars represent mean square error considering the bias inherent to the Jarzynski free energy estimator for a small number of independent simulations (n = 40) (52). The free energy profile for WT HIE (dashed black curve) and HID (dashed green curve) from Fig. 5 are included as a reference.

