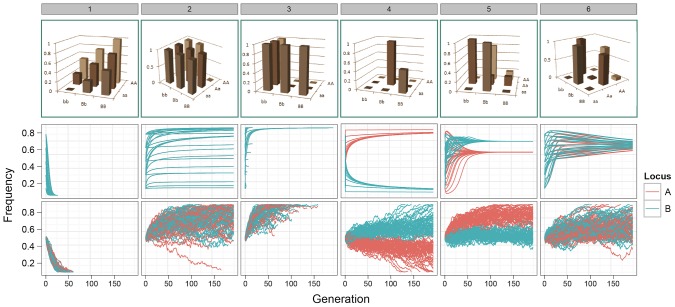
Figure 1. Allele frequency trajectories under selection.
Top row: G-P maps. 1. Independent additive effects at locus A and B; 2. Dominant pattern of canalisation; 3. Recessive pattern of canalisation; 4–6. Patterns generated by a genetic algorithm optimising for maximised additive variance and long-term survival at intermediate frequency. Middle row: Expected allele frequency trajectories for G-P maps under selection, as derived deterministically, with initial frequencies of 0.1, 0.3, 0.5, 0.7, and 0.9 enumerated over both loci. Frequencies on the  -axis correspond to alleles a/b. Only one colour appears for patterns 1–3 because the trajectories of both alleles are identical. Bottom row: The path of allele frequencies as observed through stochastic simulations of populations comprising 1000 individuals and
  at generation 0, with initial allele frequencies at both loci of 0.5.

