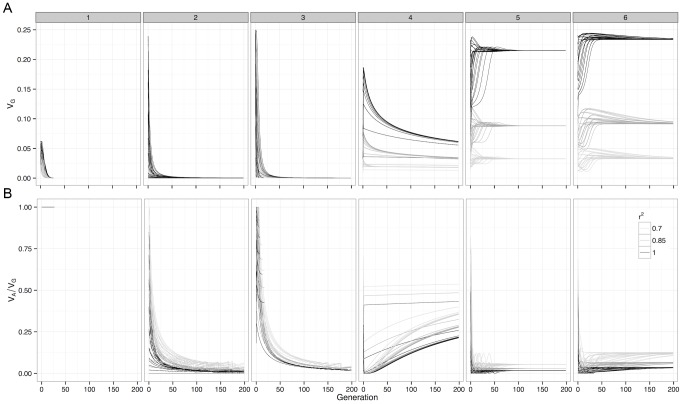
Figure 2. Deterministic change in variance components of G-P maps under selection.
For (a) Genetic variance and (b) Additive variance as a proportion of genetic variation, with initial frequencies of 0.1, 0.3, 0.5, 0.7 and 0.9 enumerated over both loci. The variance decomposition was performed at the causal locus ( ), and at SNP pairs that were in incomplete LD with the causal loci. Boxes represent the different G-P maps from Figure 1.

