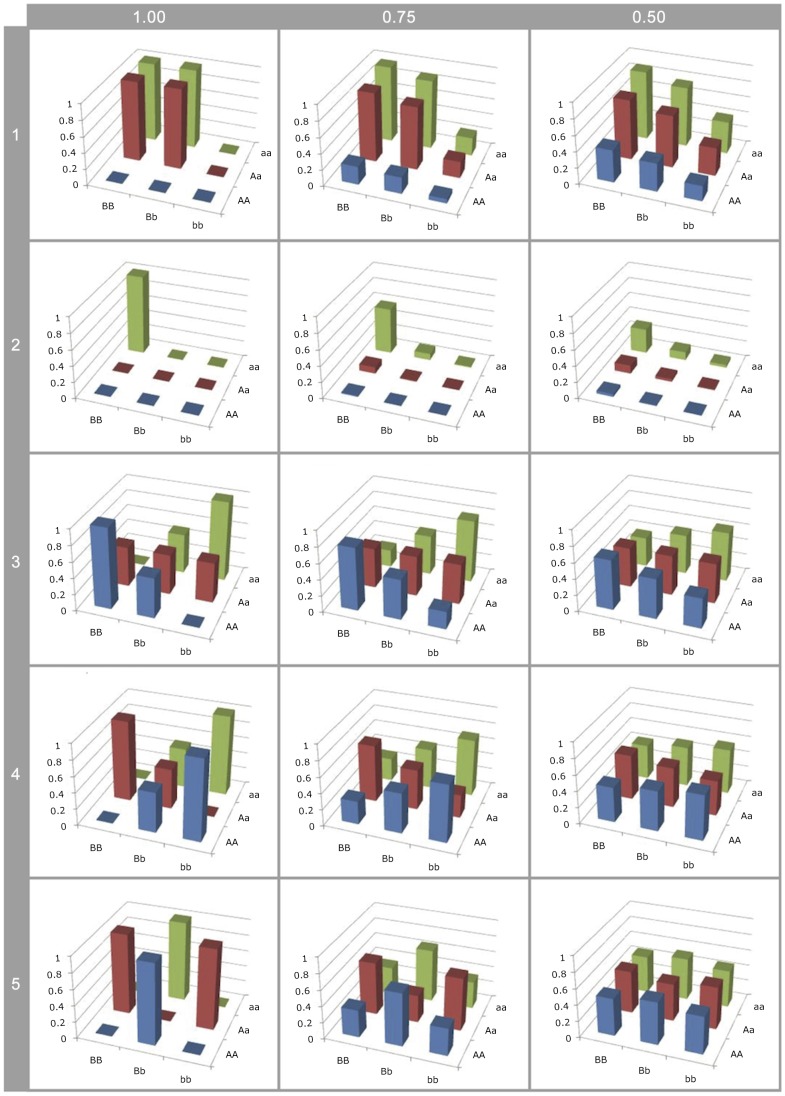
Figure 3. Effect of LD on G-P map estimation.
Different G-P maps of causal variants (rows of graphs) deterministically calculated from neighbouring SNPs in different levels of linkage disequilibrium (columns of graphs). All SNP and causal variant frequencies are set to 0.5. Rows 1–2: Canalisation; 3:  ; 4:
; 4:  ; 5:
; 5:  .
.

