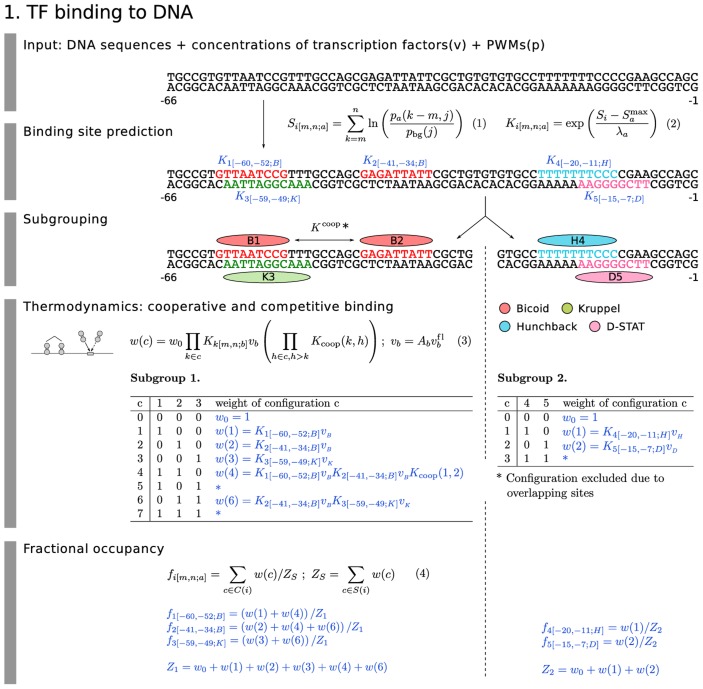
Figure 2. Model equations: TF binding to DNA.
The model equations for binding site prediction (Equation 1 and 2), cooperative and competitive binding (Equation 3) and fractional occupancy calculation (Equation 4) are shown together in a flow diagram with cartoons of each mechanism on the left and an example application in blue with 5 TF binding sites. Subgrouping process partitioning the binding sites into independent binding groups allows faster computation without losing accuracy. In the example, we set the range of quenching to 20 bp.

