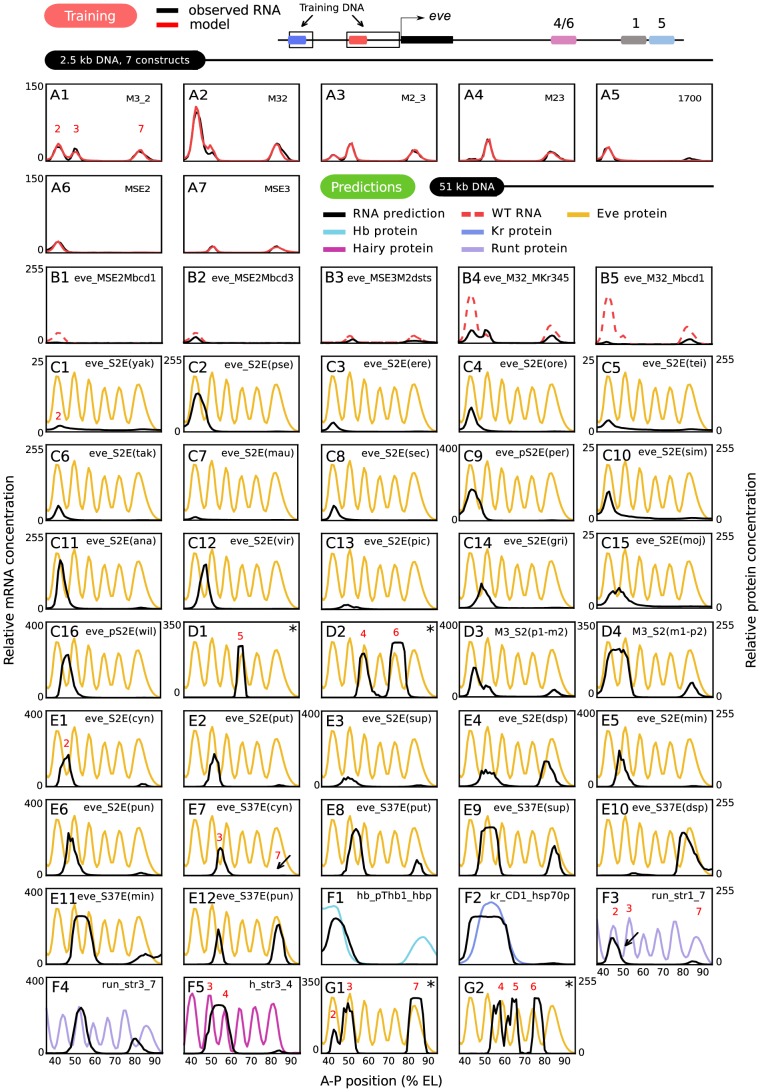
Figure 4. Training and predictions.
(A) Training results for 7 constructs. RNA levels and model results are as shown in the key; the model result trace obscures the data in regions where both are superimposed. The regions of the eve locus used to generate the training data are indicated schematically. (B–G) Predictions of gene expression driven by DNA sequences that were not used for training. The sequences used are fully described in Table S4. Black lines are predicted RNA expression and colored lines are quantitative protein profiles of the corresponding endogenous loci. The scale of relative fluorescence levels for RNA is shown at the left of graphs, that for proteins on the right. All protein patterns are taken from the FlyEx database (http://urchin.spbcas.ru/flyex) [7]. An asterisk on a panel indicates the prediction was not made from model 6: D1-2 are from model 2, G1 is from model 7, and G2 is from model 1. See text, Figure S4 and Table S1 for details. (B) 5 mutant eve enhancers, described fully in the main text. (C) Stripe 2 enhancers from 16 different Drosophila species, with abbreviations and panel numbers (see Table S5 for full species name). The enhancer from D. persimilis (per), D. grimshawi (gri), D. mojavensis (moj) and willistoni (wil) was first identified in this study. (D) Other D. melanogaster eve enhancers. (D1) Stripe 5 enhancer. (D2) Stripe 4/6 enhancer. (D3) pseudoobscura- melanogaster stripe 2 chimera(p1-m2). (D4) melanogaster- pseudoobscura stripe 2 chimera(m1-p2). (E) Stripe 2 (S2E; E1–E6) and stripe 3/7 (S37E, E7–E12) enhancers from 6 Sepsid species, with abbreviations (see Table S5). (F) 5 non- eve enhancers from the D. melanogaster genes hb (F1), Kr (F2), run (F3-4), and h (F5). (G) Large 5′ (G1) and 3′ (G2) eve regulatory DNAs that contain multiple enhancers.

