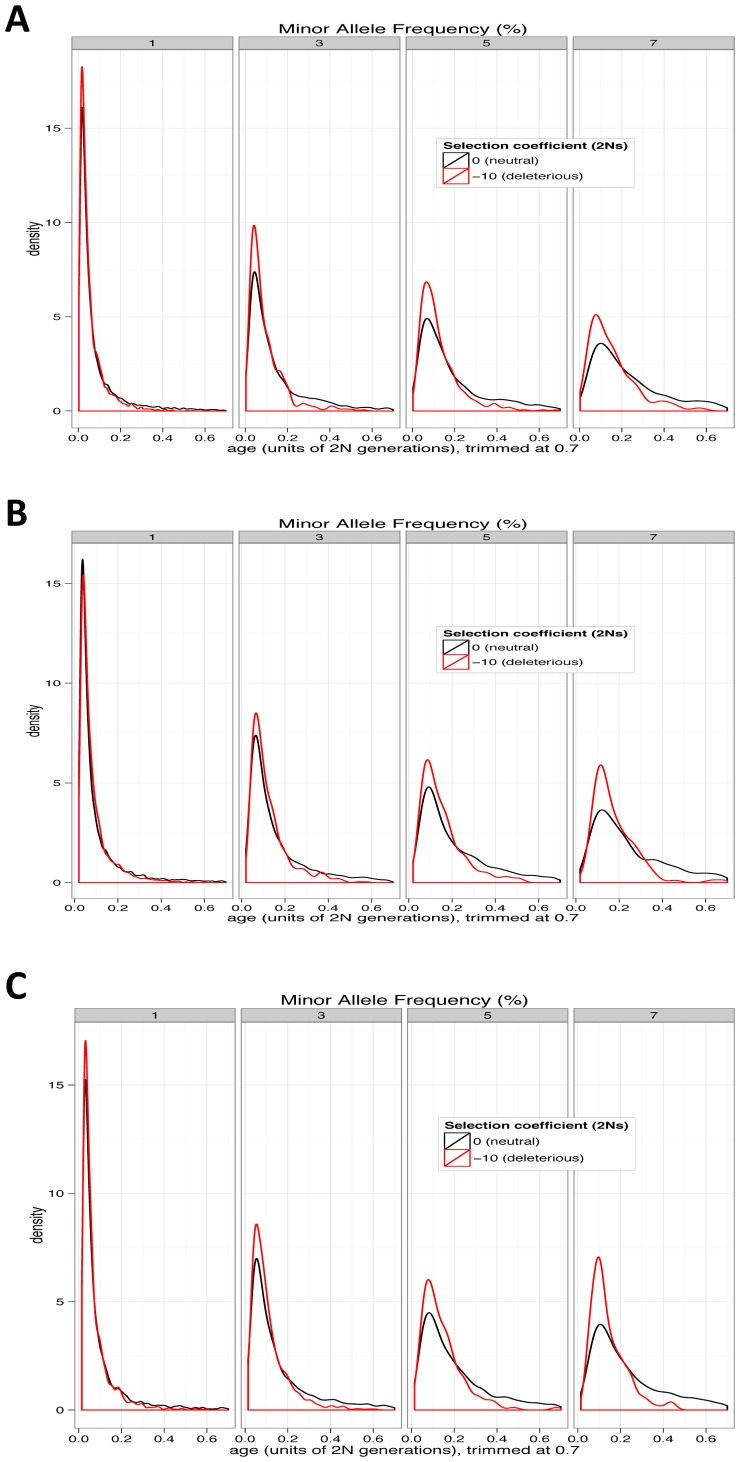
Figure 2. Age distributions for neutral and deleterious alleles from simulations.
(A) Constant-size, (B) recently rapidly expanding population, and (C) bottleneck followed by rapid expansion. For presentation, distributions are trimmed. Deleterious alleles in all cases are younger than neutral alleles at the same frequency, though the effect is weaker in rapidly expanding populations.

