
Figure 2. Estimated survival curves by genetic propensity score.
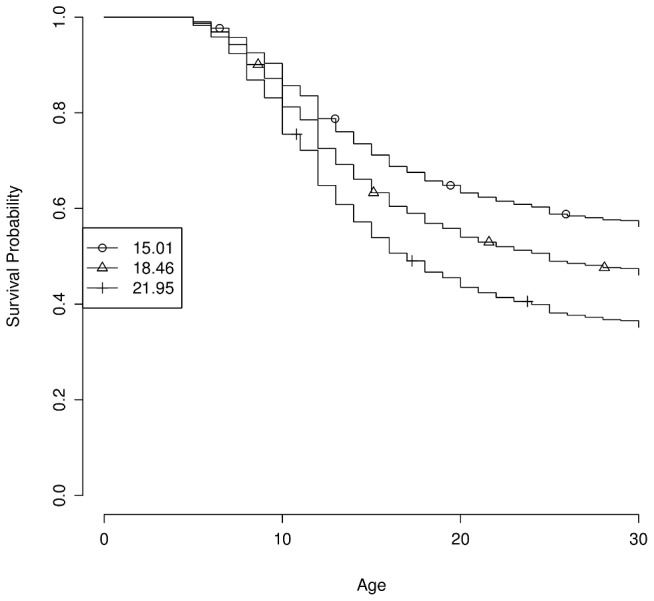
The genetic propensity score is computed as the number of risk alleles across the 22 genome-wide significant SNPs. Curves show estimated survival probability (i.e., the probability of not having developed myopia) by age under the fitted Cox model for the 10th, 50th, and 90th percentiles of scores (15.01, 18.46, and 21.95, respectively).