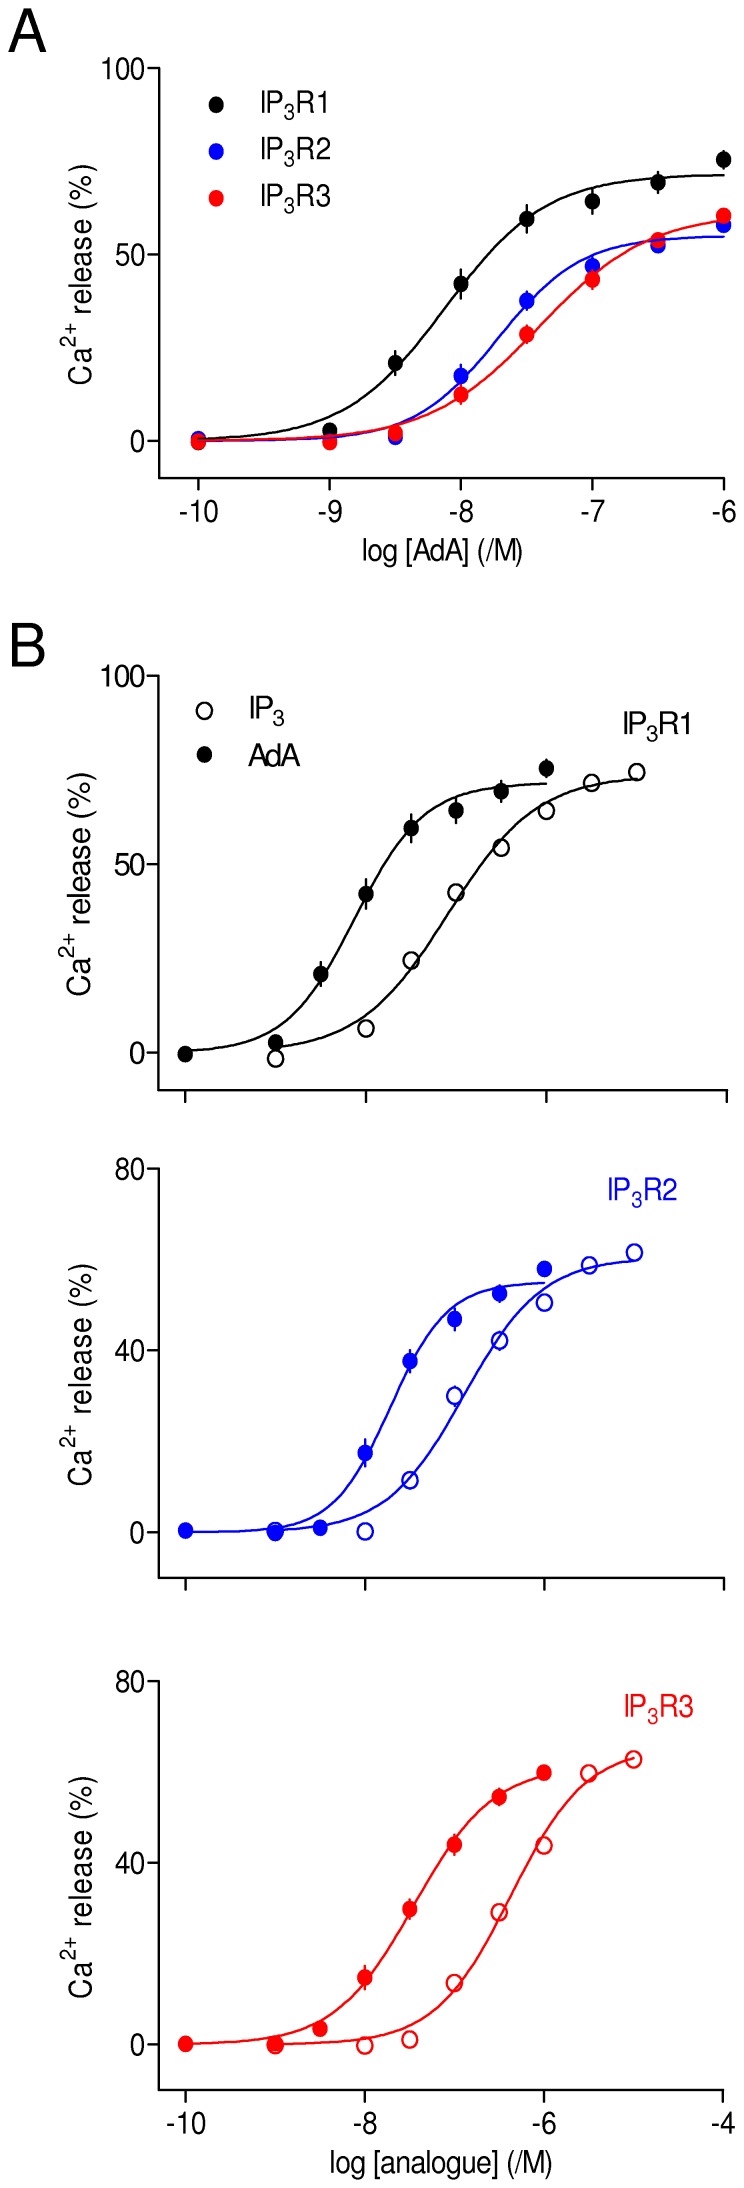
Figure 2. AdA is a potent agonist of all three IP3 receptor subtypes.
(A) Concentration-dependent effects of AdA on Ca2+ release from the intracellular stores of cells expressing IP3R1, IP3R2 or IP3R3. All results are expressed as percentages of the Ca2+ release evoked by ionomycin. The same colour codes are used in all subsequent figures. (B) Comparison, for each IP3R subtype, of the Ca2+ release evoked by IP3 and AdA. Results are means ± SEM from the number of independent experiments given in Table 1. Here, and in many subsequent figures, some error bars are smaller than the symbols.

