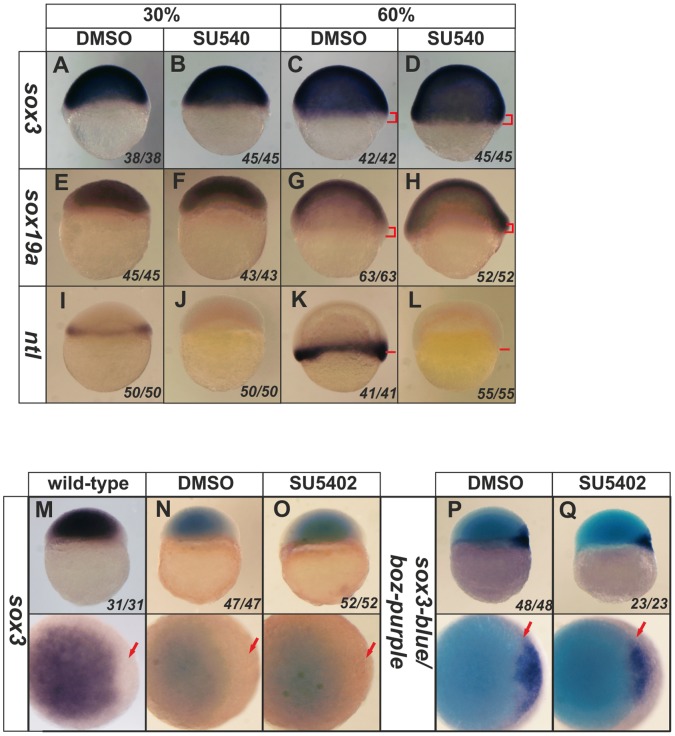
Figure 6. Inhibition of Fgf signaling causes expansion of sox3 and sox19a expression into the vegetal margin.
In situ hybridization for sox3 (A–D), sox19a (E–H) or ntl (I–L). Expression of sox3 and sox19a (dark purple) is seen throughout the entire animal hemisphere at the 30% epiboly stage, when only a very thin band of ntl expression was seen around the vegental margin (I). Although expression of ntl was completely lost following treatment with SU5402 (but not in the DMSO control) (I,J), it was not possible to detect any change in expression of sox3 or sox19a (A,B,E,F). However, treatment with SU5402 also resulted in loss of expression of ntl by the 60% epiboly stage (K,L) (position of vegetal margin identified with red bars), which was concomitant with expansion of the expression of sox3 and sox19a towards the vegetal margin (D,H) (region of expansion of expression shown with red brackets in panels C,D,G,H). Close analysis of the dorsal organizer region revealed that, as in untreated embryos (M), sox3 expression is absent from the region of the organizer. Treatment with SU5402 (or DMSO as a control) did not alter the exclusion of sox3 expression from this region (N,O). The expression of boz (dark purple) also remained unaltered with a gap in between the domains of sox3 and boz expression maintained (P,Q; arrow). All treatments were started at 3 hpf (the time that zygotic expression begins). All panels are lateral views, dorsal to the right except lower panels of M–Q, which are animal pole views. The proportion of embryos exhibiting these phenotypes is shown at the bottom right of each panel.

