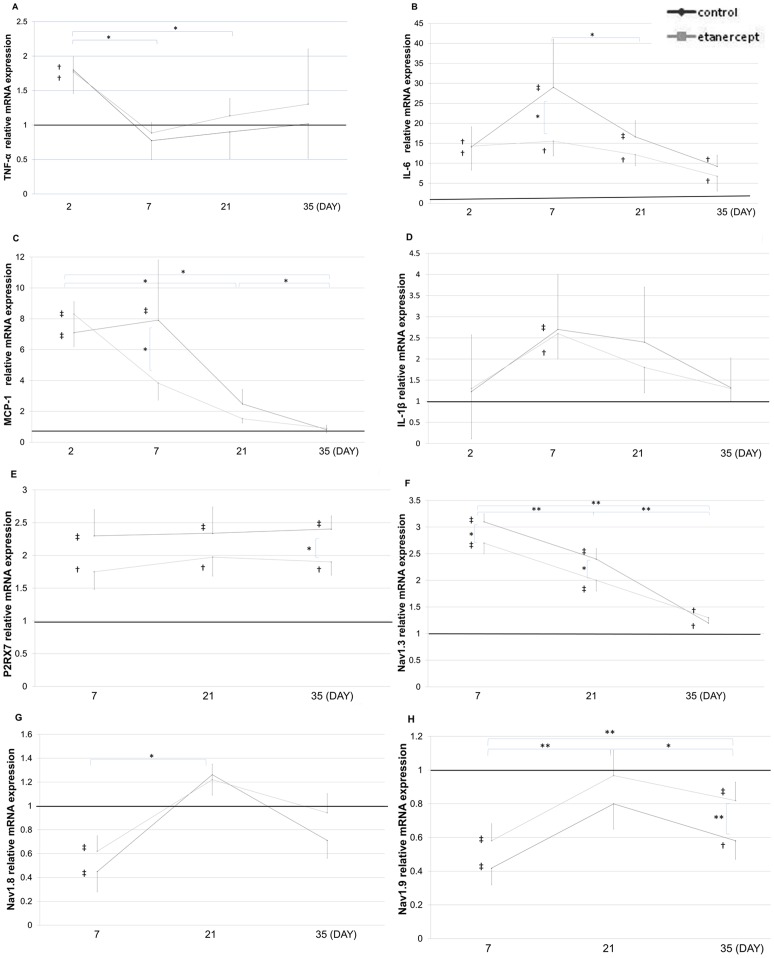
Figure 5. Effect of etanercept on mRNA expressions.
The baseline was drawn at a value of 1 (average for the sham group) (**p<0.01; *p<0.05; ‡p<0.01; †p<0.05, compared to sham group). A) Expressions of TNF-α mRNA at the crushed nerve. B) Expression of IL-6 mRNA at the crushed nerve. C) Expression of MCP-1 mRNA at the crushed nerve. D) Expression of IL-1 mRNA at the crushed nerve. E) Expression of P2RX7 mRNA at the crushed nerve. F) Expression of Nav1.3 mRNA at the L5 DRG. G) Expression of Nav1.8 mRNA at the L5 DRG. H) Expression of Nav1.9 mRNA at the L5 DRG.

