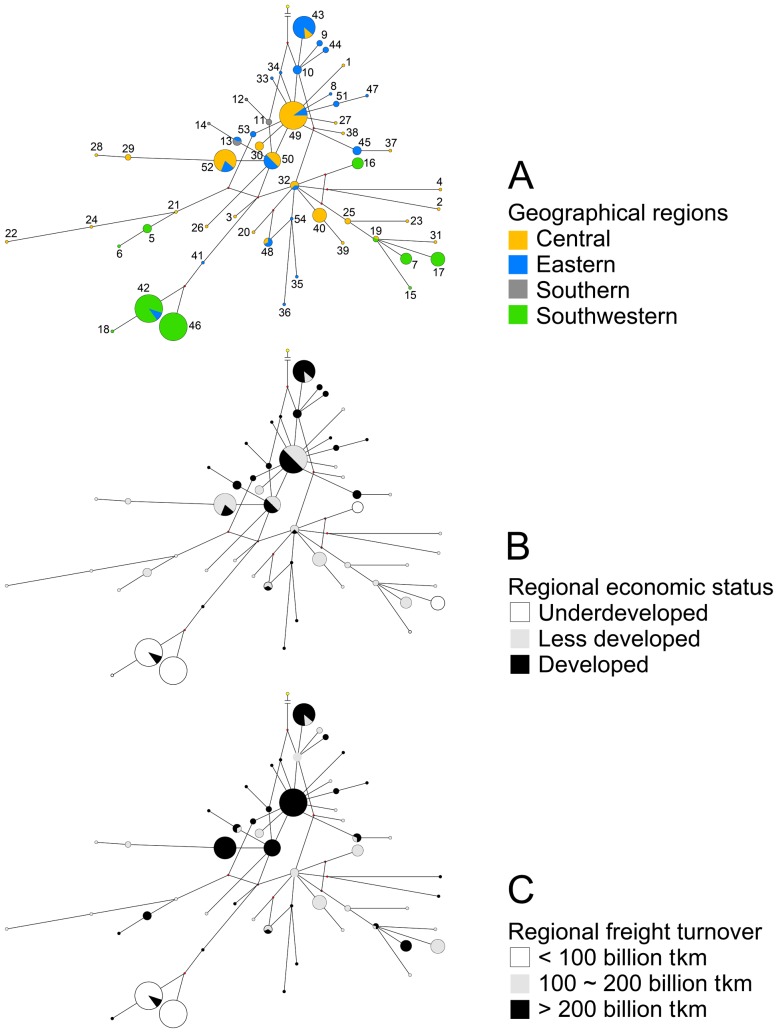
Figure 3. Depicted are the median joining networks of the 54 haplotypes of M. alternatus as categorized by (A) the geographical regions of mainland China, (B) the regional economic status, and (C) the regional freight turnover of the 14 provinces within the study region.
Node size is proportional to the number of individuals contained in each haplotype; the numbers of haplotypes correspond to the data presented in Table 2.

