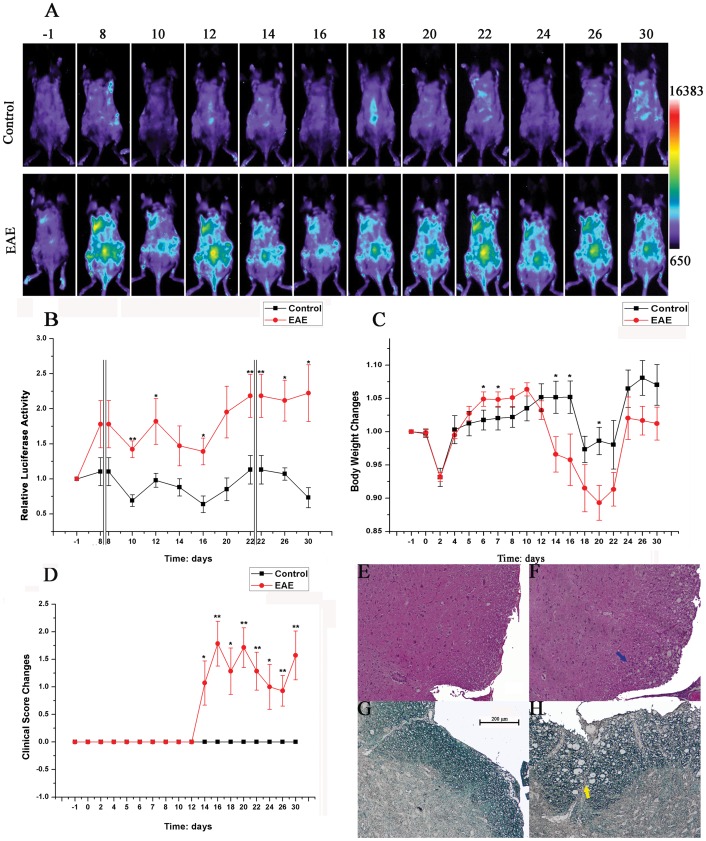
Figure 5. Luciferase expression in B6-Tg(c-Rel-luc)8Mlit mice of MOG induced experimental autoimmune encephalomyelitis (EAE) model.
(A) Female B6-Tg(c-Rel-luc)8Mlit mice were treated with CFA and with or without emulsionized MOG. Images were captured at day −1, 8, 10, 12, 14, 16, 18, 20, 22, 24, 26 and 30; (B) The quantification of luciferase activity; (C) The changes in body weight of EAE and control mice; (D) The clinical scores of EAE and control mice, n = 7; (E, F) Mouse spinal cord sections stained with H&E. (E) Section from the control mouse; (F) Section from the EAE mouse. The infiltration of inflammatory leukocytes was indicated by the blue arrow. (G, H) Mouse spinal cord sections stained with LFB. (G) Section from the control mouse; (H) Section from the EAE mouse. The demyelination in the white matter was marked by the yellow arrow. *p<0.05; **p<0.01.

