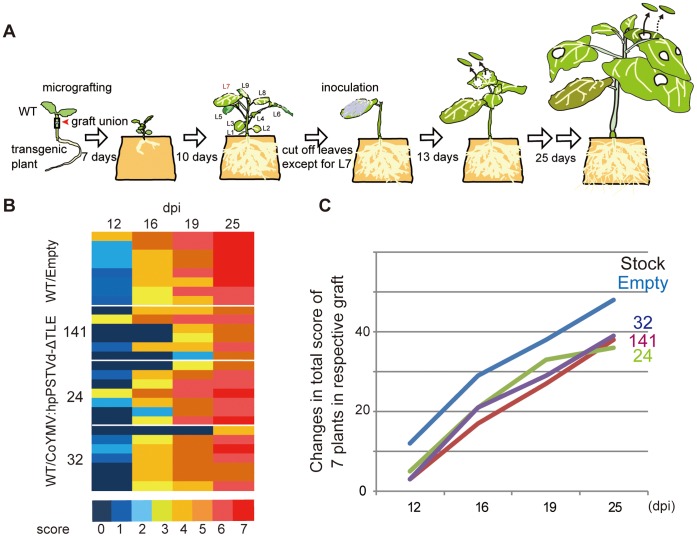
Figure 4. PSTVd accumulation in the WT scion on a CoYMV:hpPSTVd-ΔTLE stock.
(A) Illustration of the experimental procedure. At 13 dpi, leaf disks were harvested from the most newly expanded leaf. Then, sampling was done every 3 days. Seven grafted plants per line were tested. Accumulation level of the PSTVd RNA was analyzed by dot-blot hybridization (Figure S4). (B) Levels of PSTVd accumulation in the WT scion presented in the form of a heat map. The intensity of the hybridization signals was normalized relative to the 5.8S RNA signal, and sorted out from 0 no signal to 7 maximal. (C) Changes in the accumulation levels of PSTVd. Total scores for 7 grafts in each line are represented.

