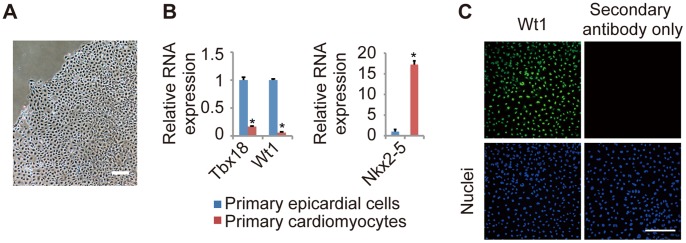
Figure 1. Primary culture of epicardial cells from E12.5 mouse embryos.

(A) Representative image of primary epicardial cells generated from E12.5 mouse hearts, as described in the Materials and Methods section. (B) The relative mRNA expression levels of epicardial markers (Tbx18 and Wt1) and a cardiomyocyte marker (Nkx2-5) in primary epicardial cells and cardiomyocytes, as determined by quantitative real-time PCR (n = 3; *P<0.0001 vs. primary epicardial cells). The results are normalized to Gapdh expression, and the relative expression level is given as a ratio to primary epicardial cells. (C) Immunostaining for Wt1 (green) and DAPI nuclear staining (blue) of primary epicardial cells after 4 days in culture. The data are presented as the mean ± SD. Scale bars: 200 µm.
