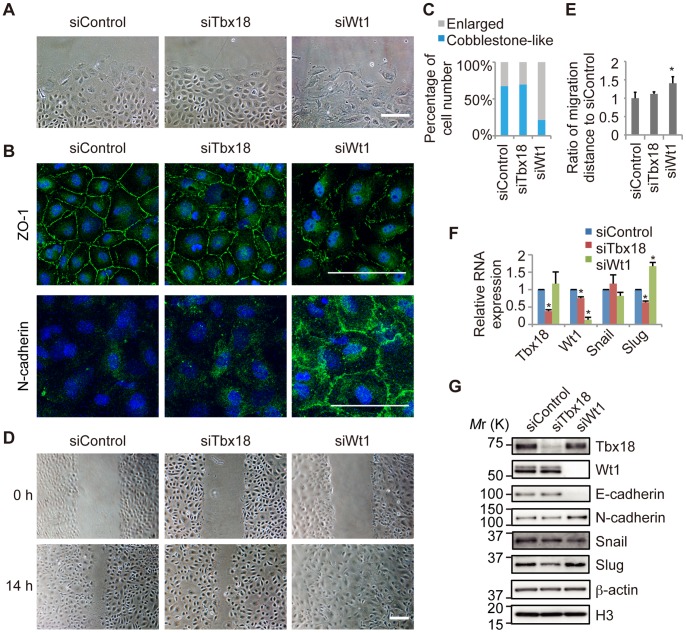
Figure 2. Knockdown of Wt1 and Tbx18 in primary epicardial cells.
(A) Representative images of primary epicardial cells transfected with control siRNA (siControl) or siRNA directed against Tbx18 (siTbx18) or Wt1 (siWt1). Scale bar: 200 µm. (B) Immunostaining for ZO-1 or N-cadherin (green) and DAPI nuclear staining (blue) of primary epicardial cells transfected with siRNAs. Scale bars: 100 µm. (C) Percentage of cells categorized as “Enlarged” or “Cobblestone-like,” based on the cellular morphology of primary epicardial cells transfected with siRNAs. (D) Representative images of primary epicardial cells transfected with siRNAs at 0 and 14 hr after the scratch was made. Scale bar: 200 µm. (E) Quantification of migration distance, given as a ratio to the siControl (n = 4; *P<0.01 vs. siControl). (F) The relative mRNA expression of Tbx18, Wt1, Snail and Slug by real-time PCR analysis (n = 3; *P<0.05 vs. siControl). The results were normalized to Gapdh expression, and the relative expression level is given as a ratio to the siControl. (G) Western blot performed with antibodies against Tbx18, Wt1, adhesion molecules (E-cadherin and N-cadherin) and EMT regulators (Snail and Slug). β-actin and histone H3 were used as loading controls. The data are presented as the mean ± SD.

