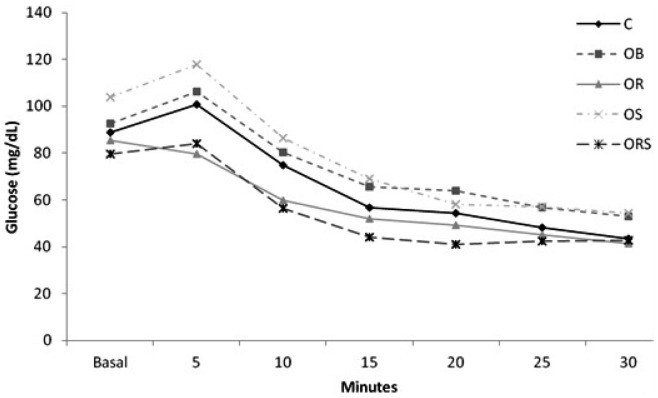
Figure 3. Glycemia during intraperitoneal insulin tolerance test.
C, control; OB, obese; OR, calorie-restricted obese; OS: obese given T3 at 25 µg/100 g BW; ORS: calorie-restricted obese rats given T3 at 25 µg/100 g BW. Blood glucose levels were measured at baseline (before administration of insulin) and 5, 10, 15, 20, 25 and 30 min after insulin administration.

