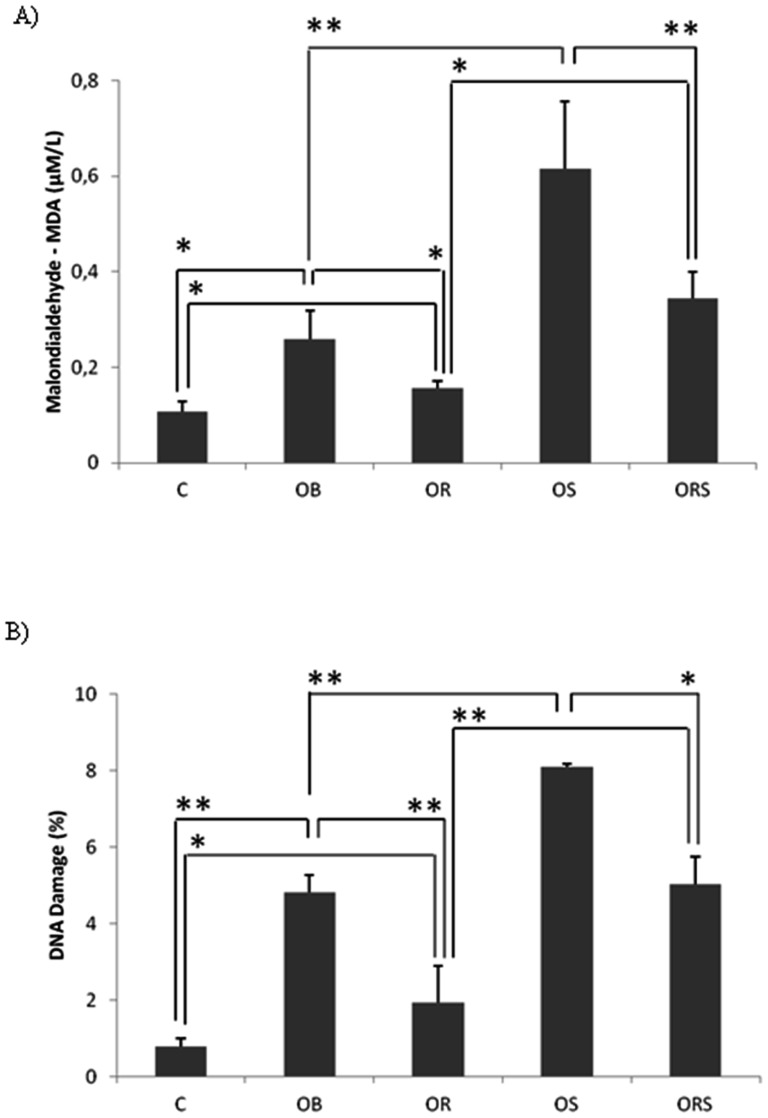
Figure 4. Oxidative stress analysis.
A) MDA measurement. B) DNA damage evaluation. C = control; OB = obese; OR = calorie-restricted obese; OS = obese given T3 at 25 µg/100 g BW; ORS, calorie-restricted obese given T3 at 25 µg/100 g BW. Data expressed as mean ± standard deviation. ANOVA was utilized, complemented by Bonferroni's test. * = p<0.05 and ** = p<0.01.

