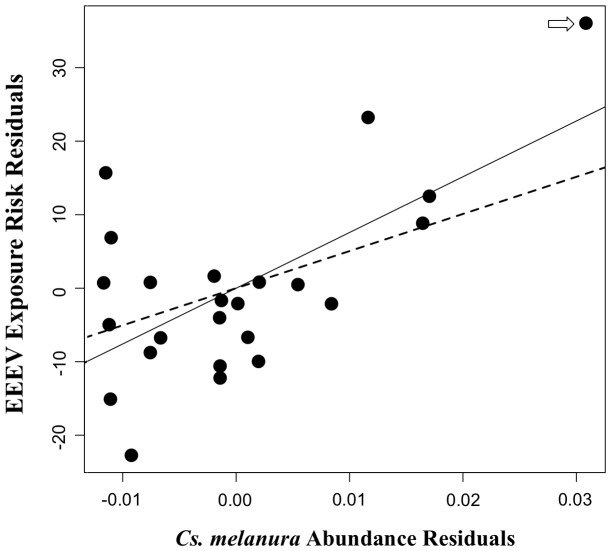
Figure 4. Association between EEEV exposure and Cs. melanura abundance.
Added-variable plot showing the relationship between EEEV exposure risk in chickens during 2009 and 2010 and Culiseta melanura abundance at 24 sentinel sites in Walton County, Florida. The estimate for the slope of EEEV exposure risk regressed on Cs. melanura was 0.0028 with a 95% UCI of (−0.0012, 0.0058). Cs. melanura abundance residuals = residuals from regression of northern cardinal density on Cs. melanura abundance, EEEV exposure risk residuals = residuals from regression of EEEV exposure risk residuals on Cs. melanura abundance. The best-fit line from simple linear regression of EEEV exposure risk residuals on northern cardinal density residuals are overlaid, with the solid line fit to the full dataset, and the dashed line fit to the dataset that excluded the influential observation shown in Figure 3.

