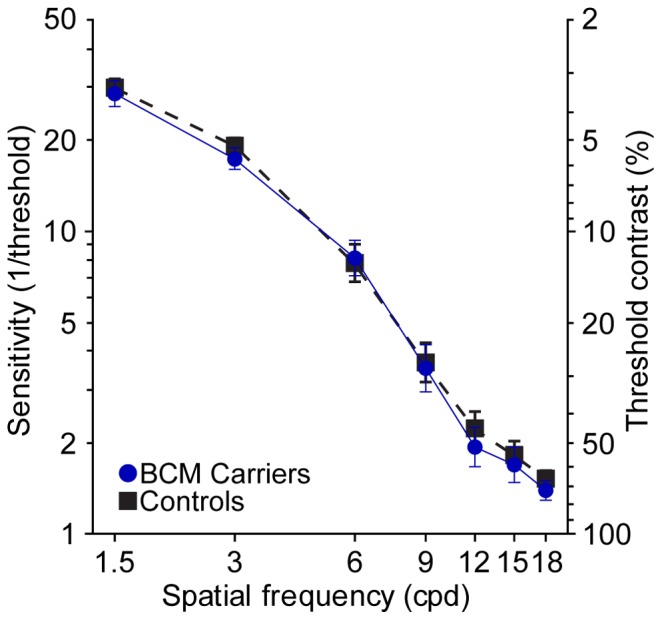
Figure 3. Contrast sensitivity functions.

The mean of 5 BCM carriers (blue circles; solid lines) are compared to 10 age matched control observers (black squares; dashed lines). Data points represent the mean of the threshold contrast at each spatial frequency for all eyes tested in each group (BCM carriers, n = 10; Controls, n = 20). Error bars are ± SEM of threshold contrast.
