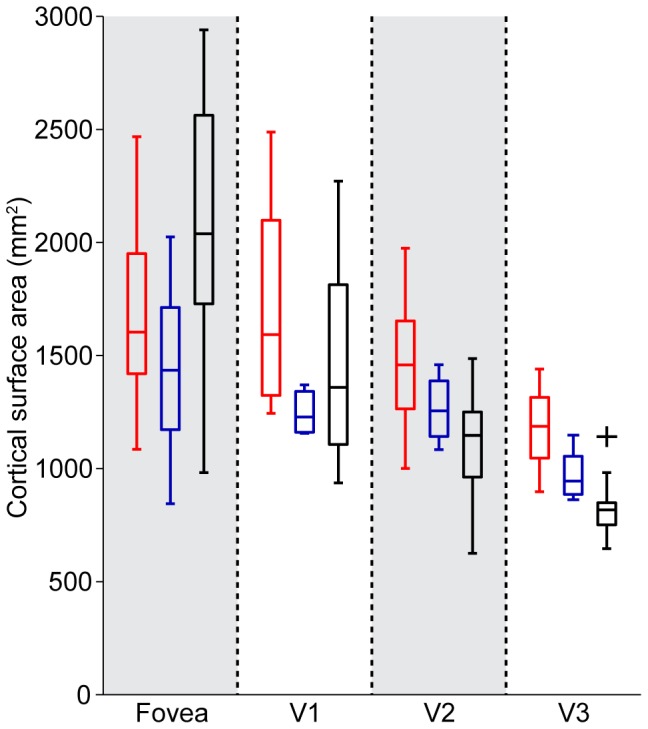
Figure 9. Cortical surface area in BCM carriers was similar to control data and published measurements obtained using similar methods.

Surface area measurements for the foveal confluence and areas V1, V2, & V3. BCM carriers (in blue) are compared to 10 controls (in red) and to the data of Dougherty et al. (2003) (in black). For each box, the central mark corresponds to the median, the edges of the box are the 25th and 75th percentiles, the whiskers extend to the most extreme data points not considered outliers, and any potential outlier is plotted individually as a black cross, such as in the V3 subpanel.
