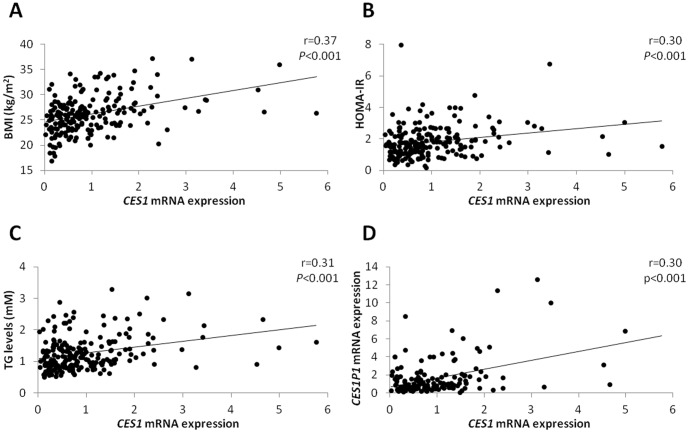
Figure 1. Correlation between CES1 mRNA expression level and selected variables.
Correlation of CES1 mRNA level with body-mass index (BMI) (A, n = 204 twin subjects), homeostasis model assessment-insulin resistance (HOMA-IR) (B, n = 203 twin subjects), fasting plasma triglyceride levels (C, n = 205 twin subjects), and CES1P1 mRNA level (D, n = 147 twin subjects), respectively, are shown. Due to technical reasons the level of CES1P1 mRNA could not be determined in a relatively large subpopulation of the twin subjects (for explanation, see ”Materials and Methods“). CES1: Carboxylesterase 1 gene; CES1P1: carboxylesterase 1 pseudogene 1; TG: triglyceride. Spearman’s rho correlation coefficients and the corresponding P-values have been included.

